U.S. Population by Major City and State
 Source: Range Magazine, Fall 2005
- Agenda 21: Social Engineering for a New World Order
- The Purpose of the Economic Meltdown
- Global Education, Land Use, and Population Control
- Sustainable Development: The Communist Agenda for the 21st Century
- Freedom Is Being Replaced By Servitude, Capitalism By Socialism, and Property Rights By 'Sustainable Development'
- Transportation System of the New World Order Excludes Private Auto Mobility
- Agenda 21: 'Walkable Urbanism' Rather Than 'Drivable Suburbanism'
- Social Engineering is Forcing People into Cities Because It is Easier to Track and Control an Urban Population
- The Wildlands Project (the 'Rewilding' of America)
- Non-Human-Use Zones in America
- Vehicle Disabling Systems
- Intelligent Transportation Systems: Big Brother Tracking Our Every Move By Vehicle and Public Transit
- The Feds Have an Official Plan for Rounding Up Americans During a 'National Emergency'
- Regimented and Dense Urban Communities — That's What Life Will Be Like in the New World Order
- Herding Americans into 'Human Settlements'
- Our 'New Way of Life' Will Depend a Whole Lot Less on Home and Automobile Ownership as People Move from Suburbs to Denser Urban Communities
- This Is What Life Will Be Like in the New World Order
- Obama's High Speed Rail System Will Be a Burden on Taxpayers
Top 50 Cities in the U.S. by Population and Rank
The table below lists the largest 50 cities in the United States based on population and rank for the years 1990, 2000, 2005, and 2007.| 7/1/2007 population estimate | 7/1/2005 population estimate | 4/1/2000 census population | 4/1/1990 census population | Numeric population change 1990–2000 | Percent population change 1990–2000 | Size rank 1990 | Size rank 2000 | Size rank 2005 | Size rank 2007 | |
|---|---|---|---|---|---|---|---|---|---|---|
| New York, N.Y. | 8,274,527 | 8,143,197 | 8,008,278 | 7,322,564 | 685,714 | 9.4 | 1 | 1 | 1 | 1 |
| Los Angeles, Calif. | 3,834,340 | 3,844,829 | 3,694,820 | 3,485,398 | 209,422 | 6.0 | 2 | 2 | 2 | 2 |
| Chicago, Ill. | 2,836,658 | 2,842,518 | 2,896,016 | 2,783,726 | 112,290 | 4.0 | 3 | 3 | 3 | 3 |
| Houston, Tex. | 2,208,180 | 2,016,582 | 1,953,631 | 1,630,553 | 323,078 | 19.8 | 4 | 4 | 4 | 4 |
| Philadelphia, Pa. | 1,449,634 | 1,463,281 | 1,517,550 | 1,585,577 | –68,027 | –4.3 | 5 | 5 | 5 | 6 |
| Phoenix, Ariz. | 1,552,259 | 1,461,575 | 1,321,045 | 983,403 | 337,642 | 34.3 | 10 | 6 | 6 | 5 |
| San Antonio, Tex. | 1,328,984 | 1,256,509 | 1,144,646 | 935,933 | 208,713 | 22.3 | 9 | 9 | 7 | 7 |
| San Diego, Calif. | 1,266,731 | 1,255,540 | 1,223,400 | 1,110,549 | 112,851 | 10.2 | 6 | 7 | 8 | 8 |
| Dallas, Tex. | 1,240,499 | 1,213,825 | 1,188,580 | 1,006,877 | 181,703 | 18.0 | 8 | 8 | 9 | 9 |
| San Jose, Calif. | 939,899 | 912,332 | 894,943 | 782,248 | 112,695 | 14.4 | 11 | 11 | 10 | 10 |
| Detroit, Mich. | 916,952 | 886,671 | 951,270 | 1,027,974 | –76,704 | –7.5 | 7 | 10 | 11 | 11 |
| Indianapolis, Ind. | 795,458 | 784,118 | 781,870 | 741,952 | 49,974 | 6.7 | 13 | 12 | 12 | 13 |
| Jacksonville, Fla. | 805,605 | 782,623 | 735,617 | 635,230 | 100,387 | 15.8 | 15 | 14 | 13 | 12 |
| San Francisco, Calif. | 764,976 | 739,426 | 776,733 | 723,959 | 52,774 | 7.3 | 14 | 13 | 14 | 14 |
| Columbus, Ohio | 747,755 | 730,657 | 711,470 | 632,910 | 78,560 | 12.4 | 16 | 15 | 15 | 15 |
| Austin, Tex. | 743,074 | 690,252 | 656,562 | 465,622 | 190,940 | 41.0 | 25 | 16 | 16 | 16 |
| Memphis, Tenn. | 674,028 | 672,277 | 650,100 | 610,337 | 39,763 | 6.5 | 18 | 18 | 17 | 18 |
| Baltimore, Md. | 637,455 | 635,815 | 651,154 | 736,014 | –84,860 | –11.5 | 12 | 17 | 18 | 20 |
| Fort Worth, Tex. | 681,818 | 624,067 | 534,694 | 447,619 | 87,075 | 19.5 | 29 | 27 | 19 | 17 |
| Charlotte, N.C. | 671,588 | 610,949 | 540,828 | 395,934 | 144,894 | 36.6 | 33 | 26 | 20 | 19 |
| El Paso, Tex. | 606,913 | 598,590 | 563,662 | 515,342 | 48,320 | 9.4 | 22 | 23 | 21 | 21 |
| Milwaukee, Wis. | 602,191 | 578,887 | 596,974 | 628,088 | –31,114 | –5.0 | 17 | 19 | 22 | 22 |
| Seattle, Wash. | 594,210 | 573,911 | 563,374 | 516,259 | 47,115 | 9.1 | 21 | 24 | 23 | 24 |
| Boston, Mass. | 599,351 | 559,034 | 589,141 | 574,283 | 14,858 | 2.6 | 20 | 20 | 24 | 23 |
| Denver, Colo. | 588,349 | 557,917 | 554,636 | 467,610 | 87,026 | 18.6 | 28 | 25 | 25 | 26 |
| Louisville, Ky.1 | 557,789 | 556,429 | 256,231 | 269,063 | 12,832 | –4.8 | 58 | 67 | 26 | 29 |
| Washington, DC | 588,292 | 550,521 | 572,059 | 606,900 | –34,841 | –5.7 | 19 | 21 | 27 | 27 |
| Nashville, Tenn.2 | 590,807 | 549,110 | 545,524 | 510,784 | 59,107 | 11.6 | 26 | 22 | 28 | 25 |
| Las Vegas, Nev. | 558,880 | 545,147 | 478,434 | 258,295 | 220,139 | 85.2 | 63 | 32 | 29 | 28 |
| Portland, Ore. | 550,396 | 533,427 | 529,121 | 437,319 | 91,802 | 21.0 | 27 | 28 | 30 | 30 |
| Oklahoma City | 547,274 | 531,324 | 506,132 | 444,719 | 61,413 | 13.8 | 30 | 29 | 31 | 31 |
| Tucson, Ariz. | 525,529 | 515,526 | 486,699 | 405,390 | 81,309 | 20.1 | 34 | 30 | 32 | 32 |
| Albuquerque, N.M. | 518,271 | 494,236 | 448,607 | 384,736 | 63,871 | 16.6 | 40 | 35 | 33 | 34 |
| Long Beach, Calif. | 466,520 | 474,014 | 461,522 | 429,433 | 32,089 | 7.5 | 32 | 34 | 34 | 36 |
| Atlanta, Ga. | 519,145 | 470,688 | 416,474 | 394,017 | 22,457 | 5.7 | 38 | 39 | 35 | 33 |
| Fresno, Calif. | 470,508 | 461,116 | 427,652 | 354,202 | 73,450 | 20.7 | 48 | 37 | 36 | 35 |
| Sacramento, Calif. | 460,242 | 456,441 | 407,018 | 369,365 | 37,653 | 10.2 | 37 | 40 | 37 | 37 |
| New Orleans, La. | – | 454,863 | 484,674 | 496,938 | –12,264 | –2.5 | 24 | 31 | 38 | – |
| Cleveland, Ohio | 438,042 | 452,208 | 478,403 | 505,616 | –27,213 | –5.4 | 23 | 33 | 39 | 40 |
| Kansas City, Mo. | 450,375 | 444,965 | 441,545 | 435,146 | 6,399 | 1.5 | 31 | 36 | 40 | 39 |
| Mesa, Ariz. | 452,933 | 442,780 | 396,375 | 288,091 | 108,284 | 37.6 | 53 | 42 | 41 | 38 |
| Virginia Beach, Va. | 434,743 | 438,415 | 425,257 | 393,069 | 32,188 | 8.2 | 39 | 38 | 42 | 41 |
| Omaha, Nebr. | 424,482 | 414,521 | 390,007 | 335,795 | 54,212 | 16.1 | 47 | 44 | 43 | 42 |
| Oakland, Calif. | 401,489 | 395,274 | 399,484 | 372,242 | 27,242 | 7.3 | 35 | 41 | 44 | 44 |
| Miami, Fla. | 409,719 | 386,417 | 362,470 | 358,548 | 3,922 | 1.1 | 46 | 47 | 45 | 43 |
| Tulsa, Okla. | 384,037 | 382,457 | 393,049 | 367,302 | 25,747 | 7.0 | 44 | 43 | 46 | 45 |
| Honolulu, Hawaii3 | 375,571 | 377,379 | 371,657 | 365,272 | 6,385 | 1.7 | 41 | 46 | 47 | 49 |
| Minneapolis, Minn. | 377,392 | 372,811 | 382,618 | 368,383 | 14,235 | 3.9 | 43 | 45 | 48 | 46 |
| Colorado Springs, Colo. | 376,427 | 369,815 | 360,890 | 281,140 | 79,750 | 28.4 | 54 | 48 | 49 | 47 |
| Arlington, Tex. | 371,038 | 362,805 | 332,969 | 261,721 | 71,248 | 27.2 | 62 | 54 | 50 | 50 |
| Raleigh, N.C. | 375,806 | – | – | – | – | – | – | – | – | 48 |
1. Louisville and Jefferson County merged in Jan. 2003. Figures prior to 2003 are for Louisville city only.
2. Nashville-Davidson city is consolidated with Davidson County.
3. Honolulu Census Designated Place; by agreement with the State of Hawaii, the Census Bureau does not show data separately for the city of Honolulu, which is coextensive with Honolulu County.
Source: U.S. Census Bureau. Web: www.census.gov.
For 1900–2005 population estimates, see Population of the 20 Largest U.S. Cities, 1900–2005.
Cities ranked & rated: more than 400 metropolitan areas evaluated in the U.S

Bar Chart of Population by State
Oddly enough, the people of four countries wouldn't have to pull up stakes and move if the world was reorganized this way: Brazil, Ireland, the United States and Yemen.
Originally Published on February 27, 2007
Queen Elizabeth II, head of state of the United Kingdom and of 31 other states and territories, is the legal owner of about 6,600 million acres of land, one sixth of the earth’s non ocean surface. She is the only person on earth who owns whole countries, and who owns countries that are not her own domestic territory.
This land ownership is separate from her role as head of state and is different from other monarchies where no such claim is made – Norway, Belgium, Denmark etc...
Her main holdings are 2,467 million acres in Canada (the 2nd largest country on earth), 1,900 million acres in Australia (the 7th largest country on earth), 114 million acres in the Papua New Guinea, 66 million acres in New Zealand, and 60 million acres in the UK. She is the world’s largest landowner by a significant margin.
Largest Five Personal Landowners on Earth:
Queen Elizabeth II (6,600 million acres)
King Abdullah of Saudi Arabia (553 million acres)
King Bhumibol of Thailand (126 million acres)
King Mohammed IV of Morocco (113 million acres)
Sultan Quaboos of Oman (76 million acres)
The next largest landowner is the Russian state, with an overall ownership of 4,219 million acres, and a direct ownership comparable with the Queen’s land holding of 2,447 million acres. The 3rd largest landowner is the Chinese state, which claims all of Chinese land, about 2,365 million acres. The 4th largest landowner on earth is the Federal Government of the United States, which owns about one third of the land of the USA, 760 million acres. The fifth largest landowner on earth is the King of Saudi Arabia with 553 million acres.
Largest Government Landowners on Earth:
Russian State (4,219 million acres)
Chinese State (2,365 million acres)
U.S. Federal Government (760 million acres)
For 1900–2005 population estimates, see Population of the 20 Largest U.S. Cities, 1900–2005.
Cities ranked & rated: more than 400 metropolitan areas evaluated in the U.S
Pie Chart of U.S. Population by State
Bar Chart of Population by State
U.S. Population by State, 1790 to 2009 (Click Here to Enlarge the Chart Below)
The following table lists the population of each state in the United States, from the year 1790 to 2009. For 2000, the data includes population per square mile of each state, as well as population rank. In 2008, Utah was the fastest growing state in terms of population. Michigan, Rhode Island, Alabama, Colorado, Connecticut, Maine, New Hampshire, and New Jersey were the only states to have decreased in population in 2008; the rest of the country saw population growth.| State | July 2009 pop.1 | July 2008 pop.1 | July 2007 pop.1 | July 2006 pop.1 | July 2004 pop. | Pop. rank, 2004 | Percent change, 1990–2000 | Pop. per sq mi, 2000 | 2000 pop. | Pop. rank, 2000 | 1990 pop. | 1950 pop. | 1900 pop. | 1790 pop. |
|---|---|---|---|---|---|---|---|---|---|---|---|---|---|---|
| Alabama | 4,708,708 | 4,627,851 | 4,661,900 | 4,599,000 | 4,530,182 | 23 | 10.1% | 87.6 | 4,447,100 | 23 | 4,040,587 | 3,061,743 | 1,828,697 | — |
| Alaska | 698,473 | 686,293 | 683,478 | 670,000 | 655,435 | 47 | 14.0 | 1.1 | 626,932 | 48 | 550,043 | 128,643 | 63,592 | — |
| Arizona | 6,595,778 | 6,500,180 | 6,338,755 | 6,166,000 | 5,743,834 | 18 | 40.0 | 45.2 | 5,130,632 | 20 | 3,665,228 | 749,587 | 122,931 | — |
| Arkansas | 2,889,450 | 2,855,390 | 2,834,797 | 2,811,000 | 2,752,629 | 32 | 13.7 | 51.3 | 2,673,400 | 33 | 2,350,725 | 1,909,511 | 1,311,564 | — |
| California | 36,961,664 | 36,756,666 | 36,553,215 | 36,458,000 | 35,893,799 | 1 | 13.8 | 217.2 | 33,871,648 | 1 | 29,760,021 | 10,586,223 | 1,485,053 | — |
| Colorado | 5,024,748 | 4,861,515 | 4,939,456 | 4,753,000 | 4,601,403 | 22 | 30.6 | 41.5 | 4,301,261 | 24 | 3,294,394 | 1,325,089 | 539,700 | — |
| Connecticut | 3,518,288 | 3,501,252 | 3,502,309 | 3,505,000 | 3,503,604 | 29 | 3.6 | 702.9 | 3,405,565 | 29 | 3,287,116 | 2,007,280 | 908,420 | 237,946 |
| Delaware | 885,122 | 873,092 | 864,764 | 853,000 | 830,364 | 45 | 17.6 | 401.0 | 783,600 | 45 | 666,168 | 318,085 | 184,735 | 59,096 |
| DC | 599,657 | 591,833 | 588,292 | 582,000 | 553,523 | — | –5.7 | 9,378.0 | 572,059 | — | 606,900 | 802,178 | 278,718 | — |
| Florida | 18,537,969 | 18,328,340 | 18,251,243 | 18,090,000 | 17,397,161 | 4 | 23.5 | 296.4 | 15,982,378 | 4 | 12,937,926 | 2,771,305 | 528,542 | — |
| Georgia | 9,829,211 | 9,685,744 | 9,544,750 | 9,364,000 | 8,829,383 | 9 | 26.4 | 141.4 | 8,186,453 | 10 | 6,478,216 | 3,444,578 | 2,216,331 | 82,548 |
| Hawaii | 1,295,178 | 1,288,198 | 1,283,388 | 1,285,000 | 1,262,840 | 42 | 9.3 | 188.6 | 1,211,537 | 42 | 1,108,229 | 499,794 | 154,001 | — |
| Idaho | 1,545,801 | 1,523,816 | 1,499,402 | 1,466,000 | 1,393,262 | 39 | 28.5 | 15.6 | 1,293,953 | 39 | 1,006,749 | 588,637 | 161,772 | — |
| Illinois | 12,910,409 | 12,901,563 | 12,852,548 | 12,832,000 | 12,713,634 | 5 | 8.6 | 223.4 | 12,419,293 | 5 | 11,430,602 | 8,712,176 | 4,821,550 | — |
| Indiana | 6,423,113 | 6,376,792 | 6,345,289 | 6,314,000 | 6,237,569 | 14 | 9.7 | 169.5 | 6,080,485 | 14 | 5,544,159 | 3,934,224 | 2,516,462 | — |
| Iowa | 3,007,856 | 3,002,555 | 2,988,046 | 2,982,000 | 2,954,451 | 30 | 5.4 | 52.4 | 2,926,324 | 30 | 2,776,755 | 2,621,073 | 2,231,853 | — |
| Kansas | 2,818,747 | 2,802,134 | 2,775,997 | 2,764,000 | 2,735,502 | 33 | 8.5 | 32.9 | 2,688,418 | 32 | 2,477,574 | 1,905,299 | 1,470,495 | — |
| Kentucky | 4,314,113 | 4,269,245 | 4,241,474 | 4,206,000 | 4,145,922 | 26 | 9.7 | 101.7 | 4,041,769 | 25 | 3,685,296 | 2,944,806 | 2,147,174 | 73,677 |
| Louisiana | 4,492,076 | 4,410,796 | 4,293,204 | 4,288,000 | 4,515,770 | 24 | 5.9 | 102.6 | 4,468,976 | 22 | 4,219,973 | 2,683,516 | 1,381,625 | — |
| Maine | 1,318,301 | 1,316,456 | 1,317,207 | 1,322,000 | 1,317,253 | 40 | 3.8 | 41.3 | 1,274,923 | 40 | 1,227,928 | 913,774 | 694,466 | 96,540 |
| Maryland | 5,699,478 | 5,633,597 | 5,618,344 | 5,616,000 | 5,558,058 | 19 | 10.8 | 541.9 | 5,296,486 | 19 | 4,781,468 | 2,343,001 | 1,188,044 | 319,728 |
| Massachusetts | 6,593,587 | 6,497,967 | 6,449,755 | 6,437,000 | 6,416,505 | 13 | 5.5 | 809.8 | 6,349,097 | 13 | 6,016,425 | 4,690,514 | 2,805,346 | 378,787 |
| Michigan | 9,969,727 | 10,003,422 | 10,071,822 | 10,096,000 | 10,112,620 | 8 | 6.9 | 175.0 | 9,938,444 | 8 | 9,295,297 | 6,371,766 | 2,420,982 | — |
| Minnesota | 5,266,214 | 5,220,393 | 5,197,621 | 5,167,000 | 5,100,958 | 21 | 12.4 | 61.8 | 4,919,479 | 21 | 4,375,099 | 2,982,483 | 1,751,394 | — |
| Mississippi | 2,951,996 | 2,938,618 | 2,918,785 | 2,911,000 | 2,902,966 | 31 | 10.5 | 60.6 | 2,844,658 | 31 | 2,573,216 | 2,178,914 | 1,551,270 | — |
| Missouri | 5,987,580 | 5,911,605 | 5,878,415 | 5,843,000 | 5,754,618 | 17 | 9.3 | 81.2 | 5,595,211 | 17 | 5,117,073 | 3,954,653 | 3,106,665 | — |
| Montana | 974,989 | 967,440 | 957,861 | 945,000 | 926,865 | 44 | 12.9 | 6.2 | 902,195 | 44 | 799,065 | 591,024 | 243,329 | — |
| Nebraska | 1,796,619 | 1,783,432 | 1,774,571 | 1,768,000 | 1,747,214 | 38 | 8.4 | 22.3 | 1,711,263 | 38 | 1,578,385 | 1,325,510 | 1,066,300 | — |
| Nevada | 2,643,085 | 2,600,167 | 2,565,382 | 2,496,000 | 2,334,771 | 35 | 66.3 | 18.2 | 1,998,257 | 35 | 1,201,833 | 160,083 | 42,335 | — |
| N.H. | 1,324,575 | 1,315,809 | 1,315,828 | 1,315,000 | 1,299,500 | 41 | 11.4 | 137.8 | 1,235,786 | 41 | 1,109,252 | 533,242 | 411,588 | 141,885 |
| New Jersey | 8,707,739 | 8,682,661 | 8,685,920 | 8,725,000 | 8,698,879 | 10 | 8.9 | 1,134.5 | 8,414,350 | 9 | 7,730,188 | 4,835,329 | 1,883,669 | 184,139 |
| New Mexico | 2,009,671 | 1,984,356 | 1,969,915 | 1,955,000 | 1,903,289 | 36 | 20.1 | 15.0 | 1,819,046 | 36 | 1,515,069 | 681,187 | 195,310 | — |
| New York | 19,541,453 | 19,490,297 | 19,297,729 | 19,306,000 | 19,227,088 | 3 | 5.5 | 401.9 | 18,976,457 | 3 | 17,990,455 | 14,830,192 | 7,268,894 | 340,120 |
| N.C. | 4,561,242 | 9,222,414 | 9,061,032 | 8,857,000 | 8,541,221 | 11 | 21.4 | 165.2 | 8,049,313 | 11 | 6,628,637 | 4,061,929 | 1,893,810 | 393,751 |
| North Dakota | 646,844 | 641,481 | 639,715 | 636,000 | 634,366 | 48 | 0.5 | 9.3 | 642,200 | 47 | 638,800 | 619,636 | 319,146 | — |
| Ohio | 11,542,645 | 11,485,910 | 11,466,917 | 11,478,000 | 11,459,011 | 7 | 4.7 | 277.3 | 11,353,140 | 7 | 10,847,115 | 7,946,627 | 4,157,545 | — |
| Oklahoma | 3,687,050 | 3,642,361 | 3,617,316 | 3,579,000 | 3,523,553 | 28 | 9.7 | 50.3 | 3,450,654 | 27 | 3,145,585 | 2,233,351 | 790,3912 | — |
| Oregon | 3,825,657 | 3,790,060 | 3,747,455 | 3,701,000 | 3,594,586 | 27 | 20.4 | 35.6 | 3,421,399 | 28 | 2,842,321 | 1,521,341 | 413,536 | — |
| Pennsylvania | 12,604,767 | 12,448,279 | 12,432,792 | 12,441,000 | 12,406,292 | 6 | 3.4 | 274.0 | 12,281,054 | 6 | 11,881,643 | 10,498,012 | 6,302,115 | 434,373 |
| Rhode Island | 1,053,209 | 1,050,788 | 1,057,832 | 1,068,000 | 1,080,632 | 43 | 4.5 | 1,003.2 | 1,048,319 | 43 | 1,003,464 | 791,896 | 428,556 | 68,825 |
| S.C. | 4,561,242 | 4,479,800 | 4,407,709 | 4,321,000 | 4,198,068 | 25 | 15.1 | 133.2 | 4,012,012 | 26 | 3,486,703 | 2,117,027 | 1,340,316 | 249,073 |
| South Dakota | 812,383 | 804,194 | 796,214 | 782,000 | 770,883 | 46 | 8.5 | 9.9 | 754,844 | 46 | 696,004 | 652,740 | 401,570 | — |
| Tennessee | 6,296,254 | 6,214,888 | 6,156,719 | 6,039,000 | 5,900,962 | 16 | 16.7 | 138.0 | 5,689,283 | 16 | 4,877,185 | 3,291,718 | 2,020,616 | 35,691 |
| Texas | 24,782,302 | 24,326,974 | 23,904,380 | 23,508,000 | 22,490,022 | 2 | 22.8 | 79.6 | 20,851,820 | 2 | 16,986,510 | 7,711,194 | 3,048,710 | — |
| Utah | 2,784,572 | 2,736,424 | 2,645,330 | 2,550,000 | 2,389,039 | 34 | 29.6 | 27.2 | 2,233,169 | 34 | 1,722,850 | 688,862 | 276,749 | — |
| Vermont | 621,760 | 621,270 | 621,254 | 624,000 | 621,394 | 49 | 8.2 | 65.8 | 608,827 | 49 | 562,758 | 377,747 | 343,641 | 85,425 |
| Virginia | 7,882,590 | 7,769,089 | 7,712,091 | 7,643,000 | 7,459,827 | 12 | 14.4 | 178.8 | 7,078,515 | 12 | 6,187,358 | 3,318,680 | 1,854,184 | 747,6103 |
| Washington | 6,664,195 | 6,549,224 | 6,468,424 | 6,396,000 | 6,203,788 | 15 | 21.1 | 88.6 | 5,894,121 | 15 | 4,866,692 | 2,378,963 | 518,103 | — |
| West Virginia | 1,819,777 | 1,814,468 | 1,812,035 | 1,818,000 | 1,815,354 | 37 | 0.8 | 75.1 | 1,808,344 | 37 | 1,793,477 | 2,005,552 | 958,800 | — |
| Wisconsin | 5,654,774 | 5,627,967 | 5,601,640 | 5,557,000 | 5,509,026 | 20 | 9.6 | 98.8 | 5,363,675 | 18 | 4,891,769 | 3,434,575 | 2,069,042 | — |
| Wyoming | 544,270 | 532,668 | 522,830 | 515,000 | 506,529 | 50 | 8.9 | 5.1 | 493,782 | 50 | 453,588 | 290,529 | 92,531 | — |
| Total U.S. | 307,006,550 | 301,621,157 | 299,398,000 | 293,655,404 | — | 13.2 | — | 281,421,906 | — | 248,709,873 | 151,325,798 | 76,212,168 | 3,929,214 | — |
1. Estimated.
2. Includes population of Indian Territory, 1900: 392,960.
3. Until 1863, Virginia included what is now West Virginia.
Source: U.S. Bureau of the Census. Web: www.census.gov.
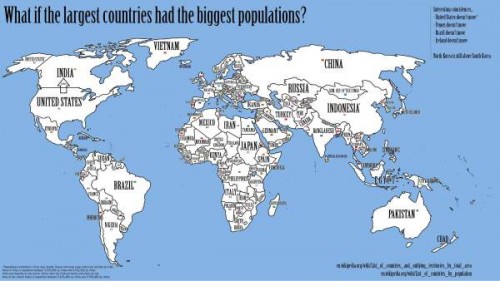
What If the Largest Countries Had the Biggest Populations?
Strange Maps' Frank Jacobs sets the stage:What if the world were rearranged so that the inhabitants of the country with the largest population would move to the country with the largest area? And the second-largest population would migrate to the second-largest country, and so on?Here's the result:
Oddly enough, the people of four countries wouldn't have to pull up stakes and move if the world was reorganized this way: Brazil, Ireland, the United States and Yemen.
Queen Elizabeth II, the Largest Individual Landowner on Earth
Who Owns the WorldOriginally Published on February 27, 2007
Queen Elizabeth II, head of state of the United Kingdom and of 31 other states and territories, is the legal owner of about 6,600 million acres of land, one sixth of the earth’s non ocean surface. She is the only person on earth who owns whole countries, and who owns countries that are not her own domestic territory.
This land ownership is separate from her role as head of state and is different from other monarchies where no such claim is made – Norway, Belgium, Denmark etc...
Her main holdings are 2,467 million acres in Canada (the 2nd largest country on earth), 1,900 million acres in Australia (the 7th largest country on earth), 114 million acres in the Papua New Guinea, 66 million acres in New Zealand, and 60 million acres in the UK. She is the world’s largest landowner by a significant margin.
Largest Five Personal Landowners on Earth:
Queen Elizabeth II (6,600 million acres)
King Abdullah of Saudi Arabia (553 million acres)
King Bhumibol of Thailand (126 million acres)
King Mohammed IV of Morocco (113 million acres)
Sultan Quaboos of Oman (76 million acres)
The next largest landowner is the Russian state, with an overall ownership of 4,219 million acres, and a direct ownership comparable with the Queen’s land holding of 2,447 million acres. The 3rd largest landowner is the Chinese state, which claims all of Chinese land, about 2,365 million acres. The 4th largest landowner on earth is the Federal Government of the United States, which owns about one third of the land of the USA, 760 million acres. The fifth largest landowner on earth is the King of Saudi Arabia with 553 million acres.
Largest Government Landowners on Earth:
Russian State (4,219 million acres)
Chinese State (2,365 million acres)
U.S. Federal Government (760 million acres)


No comments:
Post a Comment