The Public Sector Menace
According to the Bureau of Economic Analysis for 2008, the average federal employee made $79,197, excluding benefits; when benefits were added in, the average federal employee's total compensation was $119,982. The average private sector employee made $49,935; when benefits were added in, the average private employee's total compensation was $59,909. Stated differently, the benefit cost for the average federal employee back in 2008 was $40,785; the average benefit cost for private sector employees for the same year was $9,974. In 1953, about 75 percent of Federal employees had a GS level of 7 or below. By 2009, in contrast, more than 70 percent of the workforce was GS 8 or higher (the 2011 pay scale for a GS 8 is $37,631 - $48,917; for a GS 15, it is $99,628 - $129,517, and can reach a high of $155,500 when locality pay is factored in). In 2009, there were 857,275 federal employees in grades GS9-GS15 — this figure represents the entire federal workforce, not just those in the Washington, DC metropolitan area. There were 445,749 federal employees in grades GS1-GS8. Of the total U.S. workforce, about 10 million Americans have incomes over $100,000 per year.
The average government worker’s retirement pension is equivalent to the average private sector worker’s base wages while still working! And government workers typically work from ages 25 to 55, then retire for 30 years, while private sector workers typically work from ages 25 to 65, then retire for 20 years. [How Much Do Pensions Really Cost?, CalWatchDog.com, March 11, 2011]
The Democrats elected in this country, the vast majority of them, have expressly engaged in sabotage against the American people by siding with other Americans whose job it is to squeeze every last dime out of them in what is not anything other than a transfer of wealth. Public sector unions create zilch. They produce zilch. They add zero to the gross national product. It's simply wealth transfer. It's simply the redistribution of wealth. And what now has happened is that those from whom the wealth is taken have figured out that the beneficiaries of the transfer now earn twice what they who are earning the money in the first place earn. Once that was learned, once that was figured out, what did you expect to happen? Did you really think that there was so much love, adulation and respect for government workers that no matter how large the shaft job was, that the people producing the money to pay these people would just continue to bow down and say, "Oh, please continue to serve us. We love encountering you at the DMV. We can't wait to see you when we have to go get our health care. We just love seeing you people when we show up at the airport. We love getting patted down while Ahmed sails through and the granny blue hair Bloody Mary gang has to be stripped down to bare nothing looking for a nonexisting weapon while we're paying all of this." - Rush Limbaugh, "Shared Sacrifice" is Stupid, February 22, 2011
The average government worker’s retirement pension is equivalent to the average private sector worker’s base wages while still working! And government workers typically work from ages 25 to 55, then retire for 30 years, while private sector workers typically work from ages 25 to 65, then retire for 20 years. - How Much Do Pensions Really Cost?, CalWatchDog.com, March 11, 2011
The average public sector worker spends about 30 years in the workforce and 30 years retired, and the average private sector worker spends about 40 years in the workforce and 20 years retired. California public sector retirees, on average, receive a retirement pension equal to 66% of their average base pay after working 30 years while private sector retirees receive retirement benefits equal to 33% of their base pay after working 40 years (in California the average base pay of public servants is $68,000 while the average base pay of private workers is $41,500). Extrapolated to the United States as a whole, it is clear that the California model would mean that public sector retirees would cost taxpayers $862 billion per year, which is only 6% less than the entire bill for Social Security for more than six times as many people. In other words, local and state public sector workers (16% of the workforce in California) retire 10 years earlier with retirement benefits 33% greater than private sector workers (84% of the workforce) — all at the expense of the taxpayers. - The Cost of Retirement Security in America, Free Republic, January 1, 2011
The public sector employees in a pension plan get a total benefit some 25% better than the private sector employee. That is a pretty good incentive to work in the public sector. - Defined-benefit Public Sector Pensions: A Bad Habit Continues, The Economist, February 21, 2011
U.S. Civilian Labor Force and Participation Rates (Millions / Percentage)*:
1980 - 106.9 / 63.8
1990 - 125.8 / 66.5
2000 - 142.6 / 67.1
2005 - 149.3 / 66.0
2006 - 151.4 / 66.2
2007 - 153.1 / 66.0
2008 - 154.3 / 66.0
2009 - 154.1 / 65.4
2010 - 153.9 / 64.7
* Civilian non-institutional population 16 years old and older. Annual averages of monthly figures.

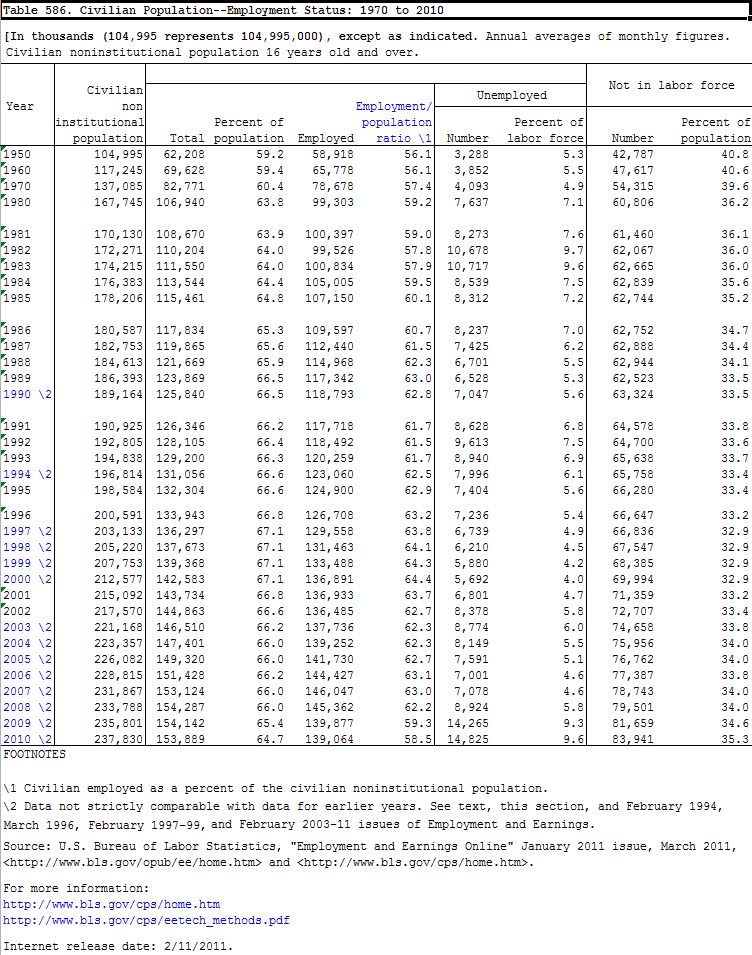

[Source: U.S. Census Bureau]
The Powerful, Politically-Connected Teachers' Unions
On February 3, 2011, on the Blaine Young Show on WFMD in Frederick County, Maryland, a public school teacher with 26 years on the job, and making $86,000 per year, defended the salaries of public school teachers and administrators. Let us compare his salary of $86,000 with the rest of Frederick County and the U.S. in general:| His Salary Minus the National Average for Federal Workers | $86,000 | - | $79,197 | = | $6,803 |
| His Salary Minus the Local Average for Federal Workers | $86,000 | - | $73,060 | = | $12,940 |
| His Salary Minus the Local Average for Teachers | $86,000 | - | $67,150 | = | $18,850 |
| His Salary Minus the State Average for Teachers | $86,000 | - | $57,000 | = | $29,000 |
| His Salary Minus the Average for Local Government Workers | $86,000 | - | $45,344 | = | $40,656 |
| His Salary Minus the Average for State Government Workers | $86,000 | - | $42,120 | = | $43,880 |
| His Salary Minus the Local Average for Private Sector Workers | $86,000 | - | $42,380 | = | $43,620 |
The teaching profession for decades has complained about being underpaid. Now they defend their extravagant salaries (while working only 10 months vs. 12 months), which are paid for by taxpayers, as if their skill level and education are far superior to the rest of the workforce and as if their contribution to society is greater than that of the average American.
Public school employees who see themselves as intellectual-elitists vote for politicians who promise them the most benefits from the public treasury. Public school workers, backed by politically-powerful labor unions, have a much higher standard of living than that of the people they serve—the taxpayers who pay their salaries, benefits and pensions.
Wages in the public sector are not driven by competition and the free market because the public sector is a monopoly. In Frederick County, the average public sector employee makes about the same as the average private sector employee; however, this is not the case for Frederick County school employees. And not only are public school employees paid much more than the private sector (as well as others in the public sector), they have generous benefits and retirement packages. Plus (like others in the public sector) they can retire after 30 years, regardless of their age, with a taxpayer-guaranteed annuity that lasts a lifetime and which is not affected by fluctuations in the stock market. These lavish pension plans have bankrupted the 50 states.
The average public sector worker spends about 30 years in the workforce and 30 years retired, while the average private sector worker spends about 40 years in the workforce and 20 years retired. On average, public sector retirees receive a pension equal to 66% of their average base pay after working 30 years while private sector retirees receive benefits equal to 33% of their base pay after working 40 years. In the case of public school employees, the average retirement pension is greater than the average private sector worker’s base wages while still working! It is no wonder that public sector retirees cost taxpayers almost as much as the entire bill for social security for more than six times as many people.
- In 2009, the average wage for the nation's 108 million private sector workers was $50,082.
- In 2009, the average wage for the nation's two million federal civilian workers was $79,197.
- In 2008, the average salary for federal civilian workers in Frederick County was $73,060
- In 2008, the average salary for local government workers in Frederick County was $45,344.
- In 2008, the average salary for state government workers in Frederick County was $42,120.
- In 2008, the average salary for private sector workers in Frederick County was $42,380.
- In 2009, the average salary for public teachers in Frederick County was $67,150.

- Frederick County Maryland Teacher Salaries (Search By Name)
- What is the average teacher salary in each state?
- Directory of links to federal, state, county and municipal government salary and employee name databases
- Don't Let the Powerful, Politically-connected Teachers' Unions Bully You Into Submission or Use Your Kids as Props for Union Demands; Your Property Taxes/A Portion of Your Rent Pay Their Generous Salaries & Benefits
- Federal Employees Database of Salaries
What to Know About Illinois Public School Teacher and Administrator Pay
Family Taxpayers FoundationMarch 8, 2007
School researcher Jay Greene wrote last year about what he called “the teacher pay myth”:
"The common assertion that teachers are severely underpaid when compared to workers in similar professions is so omnipresent that many Americans simply accept it as gospel… But the facts tell a different story."In a study released in January 2007, Greene reported that –
"When considering teacher pay, policymakers should be aware that public school teachers, on average, are paid 36% more per-hour than the average white-collar worker and 11% more than the average professional specialty and technical worker. They should be aware that the higher relative pay for public school teachers exists in almost every metro area for which data are available. Finally, they should be aware that paying public school teachers more does not appear to be associated with higher student achievement."
In Illinois, the Family Taxpayers Foundation has conducted a study of their pay increases and estimated pensions. What’s evident is that the rate of pay increases and the pension benefits far out-pace anything seen by private sector employees.
Part of the reason for this disparity has to do with the fact that public sector unions — in this case, the teacher unions — operate as a monopoly within a monopoly.Click here to read “The Problem with Public Sector Unions.”
Click here to read “Public-Sector Unions Are a Major Obstacle to Fighting Waste, Abuse.”
2011 Federal Pay Scale Tables (GS)
Saving to Inve$t - Following President Obama’s Federal employee pay freeze, 2011 GS tables remain the same as 2010. This includes the special base rates for GS law enforcement officers (GL) at GS grades 3 through 10. Unfortunately this means that the proposed raises discussed in previous updates below will not come to pass in 2011. The latest table is shown below, with rates effective from January 2011.
In 1953, about 75 percent of Federal employees had a GS level of 7 or below. By 2009, in contrast, more than 70 percent of the workforce was GS 8 or higher.
The General Schedule consists of 15 pay grades and 10 steps within those pay grades. GS grades 1 through 7 denote entry-level positions, while grades 8 through 12 mark mid-level positions and grades 13 through 15 are top-level and management positions. The General Schedule also incorporates locality pay adjustments to account for cost-of-living differences across the country and overseas.

Pay Scales at TSA (2010)
From the Transportation Security Agency WebsiteWe are unique among our fellow Federal employees because we do not use the standard GS grading system you may be familiar with. We use an "SV" grading system, which is a system of discrete grades with pay ranges that differ from GS pay ranges. These discrete grades, which are identified by letters rather than numbers, have minimum and maximum rates.
In the table below, we show the ranges for each pay band.
| Pay Band | Minimum | Maximum |
|---|---|---|
| A | $17,083 | $24,977 |
| B | $19,570 | $28,546 |
| C | $22,167 | $33,303 |
| D | $25,518 | $38,277 |
| E | $29,302 | $44,007 |
| F | $33,627 | $50,494 |
| G | $39,358 | $60,982 |
| H | $48,007 | $74,390 |
| I | $58,495 | $90,717 |
| J | $71,364 | $110,612 |
| K | $85,311 | $132,237 |
| L | $101,962 | $155,500 |
| M | $120,236 | $155,500 |
The above rates are basic pay rates and do not include locality pay. 2010 basic pay rates are limited to $155,500. 2010 adjusted pay rates (base pay plus locality) are limited to $172,550.
Fighting Public-Sector Unions
Boston GlobeJanuary 9, 2011
As resistance to public-sector unionism has intensified, many of the noisiest confrontations have been on the coasts.
In New Jersey, freshman Governor Chris Christie has been locked in a battle royale with his state’s powerful teachers unions. In California, Oakland’s new mayor began her first full day in office by demanding that unionized police officers, who pay nothing toward their pensions, be required to contribute 9 percent of their salaries. In New York, federal prosecutors have opened a criminal investigation into whether Sanitation Department workers purposely paralyzed the city with a work slowdown during last month’s blizzard. In Massachusetts, Governor Deval Patrick infuriated public-safety unions by replacing costly police details with civilian flaggers at many construction and repair sites.
Now the Midwest is poised to become a major theater in the war against insatiable government unions.
Within days of taking office in 2005, two Republican governors — Mitch Daniels in Indiana and Matt Blunt in Missouri — issued executive orders rolling back collective-bargaining rights for state workers. Because public-sector unions in those states had been granted the right to bargain collectively through executive orders in the first place, Daniels and Blunt had only to rescind their predecessors’ actions.
In most states, however, public-employee unions are authorized by statute to negotiate wages, pensions, and health care. Any effort to weaken or repeal those laws is guaranteed to face bitter resistance from the unions and their legislative allies.
Two newly elected Republican governors say they’re ready for that fight.
Even before he was sworn in last week, Wisconsin Governor Scott Walker had fired a shot across the bow of his state’s public-sector unions. Speaking to the Milwaukee Press Club, he said he would consider using “every legal means’’ to weaken those unions — from decertifying their exclusive right to bargain on behalf of state employees to modifying state law.
“You are not going to hear me degrade state and local employees in the public sector,’’ Walker said. “But we can no longer live in a society where the public employees are the haves and the taxpayers who foot the bills are the have-nots.’’More than 50 years ago, Wisconsin was the first state to enact a public-sector collective-bargaining law, and killing it outright might be too tall an order even for a governor whose party controls both houses of the legislature. But Walker and like-minded lawmakers may well succeed in excluding from collective bargaining the most highly-abused benefit categories, such as pensions and health insurance.
In Ohio, meanwhile, incoming Governor John Kasich has long made ending public-sector collective bargaining a priority. In 2009 he said he wanted to “break the back of organized labor in the schools,’’ and last month he underscored his conviction that government workers who go on strike should be fired.
“I really don’t favor the right to strike by any public employee,’’ Kasich said. “They’ve got good jobs, they’ve got high pay, they get good benefits, a great retirement. What are they striking for?’’He is just as hostile to binding arbitration, which many states require when strikes are illegal, and government managers and public-sector unions are at an impasse.
“Binding arbitration,’’ Kasich says bluntly, “is not acceptable.’’
It was Calvin Coolidge who, as governor of Massachusetts during a police strike in 1919, famously declared:
“There is no right to strike against the public safety by anyone, anywhere, any time.’’Coolidge’s assertion made him a rising star in national Republican circles, but opposition to public-sector unionism has an honorable Democratic pedigree as well.
“The process of collective bargaining, as usually understood, cannot be transplanted into the public service,’’ President Franklin D. Roosevelt wrote in 1937.He recognized that government can never be just another employer, and that empowering labor unions to negotiate wages and benefits with public officials would inevitably result in abuse.
Today, evidence of that abuse is everywhere. Private employees find themselves working longer and being taxed more heavily so that government employees can enjoy outlandish pay and perks.
“Public-sector unions have become the exploiters,’’ Minnesota’s outgoing Governor Tim Pawlenty argued last month, “and working families once again need someone to stand up for them.’’In the heartland as on the coasts, that challenge is being taken up.
Public Pay, Benefits Set Off New 'Civil War'
Corporations have been moving away in massive numbers from the defined benefit programs that governments had emulated. In 2008, just 48,000 companies in the U.S. offered pension programs -- down from 150,000 in 1988. Instead of maintaining costly pensions and committing to a lifetime of defined benefits for retirees, companies contributed to mobile retirement accounts, such as 401(k)s. The nation's workforce has also changed. By January 2010, for the first time, public employees made up the largest percentage of union workers. Several recent studies show that at least some public employees now make more than their private-sector counterparts, although that is not true across the board.Low-wage public-sector workers also had better access to retirement plans: 74% were eligible, compared with 40% in the private sector. - The Public Sector “Haves” Get Richer Benefits Too…, The Swine Line, July 28, 2010

Star Tribune
February 13, 2011
For years, government work was seen as a tradeoff: slightly lower salaries in exchange for security, good benefits and a comfortable pension. Over time, other perks crept in.
At the University of Minnesota, employees attended school free until last year; they now pay 25 percent. Up until just a few years ago, Duluth city employees got free health care when they retired -- including public safety workers who could retire in their mid-40s with young families.
Corporations, meanwhile, have been moving away in massive numbers from the defined benefit programs that governments had emulated.
In 2008, just 48,000 companies in the U.S. offered pension programs -- down from 150,000 in 1988.
Instead of maintaining costly pensions and committing to a lifetime of defined benefits for retirees, companies contributed to mobile retirement accounts, such as 401(k)s.
The nation's workforce has also changed. By January 2010, for the first time, public employees made up the largest percentage of union workers. Several recent studies show that at least some public employees now make more than their private-sector counterparts, although that is not true across the board.
As the economy soured, resentments got new breath and the GOP grabbed hold.
Former Gov. Tim Pawlenty, a Republican with presidential aspirations, has taken to calling the rise of government unions "a silent coup."
State Rep. Keith Downey, R-Edina, said we need to "starve the beast" as he unveiled a proposal to cut the state's workforce 15 percent.
Government workers say they are sick of being demonized at dinner parties and on the stump, where they are reviled as lazy and inferior. They also resent the criticism for hard-fought union contracts they say are tough, but fair.
Mike Buesing, 62, said the rancor has reached a crescendo. A skilled highway construction planner, Buesing has put in 38 years at the state Department of Transportation. He owns a modest townhouse in Shoreview with a mortgage and makes $54,000 annually. When he retires later this year, he'll take in about $3,000 monthly from his pension.
"I am not living high off the hog," Buesing said. "It's a struggle, paycheck to paycheck. People think I am making a lot more money than I am. When I tell them, they usually are surprised."Union leaders note that employees like Buesing are on the high end. State retiree pensions average a modest $13,000 a year.
Eliot Seide, president of AFSCME Council 5, said that such pensions are a testament to the union belief that middle-class workers should be able to enjoy retirement "with dignity."
Taxpayer risk
But in a badly battered economy, that level of comfort comes with big risks for taxpayers. The state faces a $14 billion unfunded liability in coming decades for the 644,000 state workers who are or will be eligible for pensions. That's about $3,200 for every person in Minnesota.
Union officials say the problem is less about increasing benefits and more about investments that sagged during the recession. The pension shortfall has become less breathtaking as those investments have rebounded. Pension analysts also note that the problem stretches over 30 years, allowing ample time for modifications.
But the problem is not just theoretical.
Moody's Investor Service, a premier credit-rating agency, issued a report this year that added pension obligations to its formula for determining a state's fiscal health.
Minnesota holds one of the best credit ratings in the nation, but adding in its unfunded pension liability drops it to the middle of the pack.
On Wednesday, the rating agency Standard & Poor's downgraded New Jersey's bond rating. The reason? Its mounting pension obligations.
"There isn't a push to get rid of pensions; it's to lower dollars going in," said former State Auditor Pat Anderson, a Republican who joined the Minnesota Free Market Institute's Pension Reform Project.Anderson and others say the pension system encourages risk-averse employees who never leave.
The longer they stay, the more seniority they acquire and the sweeter their pension becomes.
That, she said, leaves little room for more entrepreneurial types.
"If we want to attract good people to government, who aren't careerist, you need a system that works," she said.Anderson, for all her criticism of the system, will receive money from two government programs when she retires: one from her time as mayor and city councilwoman in Eagan, plus additional benefits from her term as an elected state official.
Pawlenty, who has criticized public employees' "Cadillac" health care plans, requested a letter before he left office outlining his future state health care benefits. The former legislator and state employee can draw from two state retirement programs, including a defined benefit pension program, when he retires.
Pensions: The Haves and the Have-nots
In 2002, there were 5.1 people of working age for each pensioner, but by 2030 this ratio is expected to fall to just 2.7 people. Workers will need to secure sufficient saving to support their retirement and avoid a decline in living standards. Demographic trends are also showing a shift in household dynamics. This can be expected to affect social infrastructure planning and delivery requirements. Households are getting smaller with fewer households including children. In 2001, the largest household-type consisted of a couple with children. However, divorce rates are high at 33 per cent, and between 1986 and 2001, the incidence of single-parent families increased by 53 percent. Nevertheless it is single person households followed by couple households without children that are expected to become the most prevalent type in the coming decades. - The future of the public sector in 2025, The Victorian Government State Services Authority 2006The Daily Mail
Originally Published on December 28, 2006
This paper has great admiration for many public sector workers. Where would we be without dedicated teachers, NHS staff, servicemen, firemen and police? Even back-room bureaucrats (though we have far too many of them) perform functions vital to the smooth running of any modern nation. Like everyone else, they deserve decent pensions.
But none of this can silence our growing disquiet over the Government's feather-bedding of public employees at the expense of wealth-producers in the private sector.
Alarming figures, collated for the Mail by the authoritative Institute of Economic Affairs (IEA), show that the average family has had to contribute nearly £1,000 this year to finance the gold-plated pensions of public sector workers.
This wouldn't be so bad if the money was invested, like private funds, in pension pots that grow to meet future needs.
But the great majority of state sector pensions are unfunded -- meaning that money is transferred straight from the pay-packets of today's workers into the bank accounts of former public employees.
So as the years go by, and more workers in the swollen state sector reach retirement age, the burden on successive generations will grow even greater. Over the next three decades, predicts the IEA, the bill will increase to £76billion a year -- around £3,000 for each family.
All this would be hard enough to stomach if those being made to finance inflation-proof public sector pensions could look forward to similar benefits themselves. What makes it intolerable is the huge disparity between the perks offered to state and private employees.
With his £5billion-a-year raid on pension funds, Chancellor Gordon Brown has all but killed official-salary pensions in the private sector. But they remain the norm for state employees. Meanwhile millions of Britons cannot afford to save for a pension -- while others have to wait years longer than state employees before they can start drawing on their savings.
What we are seeing is a growing chasm between the haves in the public sector and have-nots in the rest of the economy. This is divisive and wholly unfair.
By all means let Mr Brown make proper provision for public employees. But he should remember that the Government was elected to serve the whole nation -- not just to pamper a part of if.
Public Sector Pay Outpaces Private Pay
Innovation and GrowthMay 3, 2010
We all know that state and local government finances are a mess. This chart helps explain why.

The top line tracks the real compensation of all state and local government workers–wages and benefits, adjusted for inflation. The lower line tracks the real compensation of all private sector workers. The data comes from the Employment Cost Index data published by the BLS.
The chart shows that public and private sector pay rose in parallel from 2001 to 2004. Then the lines diverged. Since early 2005, public sector pay has risen by 5% in real terms. Meanwhile, private sector pay has been flat.

It's Time to Freeze Government Wages
RealClearMarketsJanuary 19, 2010
There’s a recession going on, but you wouldn’t necessarily know it by looking at public employee earnings. If you work for the government, you’re far less likely than your private-sector counterparts to have been laid off in the recession, and you probably also saw relatively fast wage growth.
As states and localities continue to fight budget crises, they have an opportunity to close gaps by freezing employee wages. Because public employee compensation rose too fast over the last three years, they should be able to do this while retaining quality employees at least as well as they could back in 2006.
During the recession, public employees have done better than private ones on two measures: total employment and hourly compensation. Over the last two years, private payrolls shed 7.3 million jobs, but public sector civilian employment actually grew very slightly, adding 98,000 jobs.
This makes sense: public-sector layoffs cause anti-stimulative ripples through the economy, and governments might even capitalize on a recession as a good time to hire employees cheaply.
The trouble is, that’s not what they’ve been doing. Instead, they’ve been retaining employees expensively.
In a recession when wages are stagnating, you would expect governments to capitalize on the loose labor market by holding the line on employee compensation. But public sector compensation (as measured by the Department of Labor) rose 42% faster than private sector compensation over the last three years.
Since the end of 2006, hourly total compensation (wages plus benefits) has risen 6.5% for private sector workers, essentially keeping pace with inflation. But state and local government workers saw their hourly compensation rise 9.2%.
Federal civilian workers (about 10% of the public sector civilian workforce) are excluded from the above measure, but they did even better, receiving Congressionally-approved wage rises totaling 9.9% over the same period.

Why have public sector wages grown so fast? In some cases, it’s because employees are receiving scheduled raises under contracts negotiated before the economic crisis. New York public employees will see a 4% pay increase in April, under a contract negotiated in the middle of the last decade...
Private Paychecks Drop to Lowest Level Ever in the U.S. as Government-Provided Benefits Rise to Historic Highs
USA TODAYMay 25, 2010
Paychecks from private business shrank to their smallest share of personal income in U.S. history during the first quarter of this year, a USA TODAY analysis of government data finds.
At the same time, government-provided benefits — from Social Security, unemployment insurance, food stamps and other programs — rose to a record high during the first three months of 2010.
Those records reflect a long-term trend accelerated by the recession and the federal stimulus program to counteract the downturn. The result is a major shift in the source of personal income from private wages to government programs.
The trend is not sustainable, says University of Michigan economist Donald Grimes. Reason: The federal government depends on private wages to generate income taxes to pay for its ever-more-expensive programs. Government-generated income is taxed at lower rates or not at all, he says...
Class War: How Public Servants Became Our Masters
By Steven Greenhut, Reason MagazineFebruary 2010
The average federal salary (including benefits) is set to grow from $72,800 in 2008 to $75,419 in 2010, CBS reported. But the real action isn’t in what government employees are being paid today; it’s in what they’re being promised for tomorrow. Public pensions have swollen to unrecognizable proportions during the last decade. In June 2005, BusinessWeek reported that
“More than 14 million public servants and 6 million retirees are owed $2.37 trillion by more than 2,000 different states, cities and agencies,” numbers that have risen since then.State and local pension payouts, the magazine found, had increased 50 percent in just five years.
These huge pension increases have eaten away at public finances, most spectacularly in California, where a bipartisan bill that passed virtually without debate unleashed the odious “3 percent at 50” retirement plan in 1999. Under this plan, at age 50 many categories of public employees are eligible for 3 percent of their final year’s pay multiplied by the number of years they’ve worked. So if a police officer starts working at age 20, he can retire at 50 with 90 percent of his final salary until he dies, and then his spouse receives that money for the rest of her life. Even during the economic crisis, “3 percent at 50” and the forces behind it have only become more entrenched...
Pension Tsunami
Although Americans may have a vague sense that the nation has run up a great deal of debt, the public employee benefit problem is not well known. Yet the wave of benefit promises is poised to wash away state and local government budgets and large portions of the incomes of most Americans. Most of these benefits are vested, meaning that they have the standing of a legal contract. They cannot be reduced. And the government employees’ allies, such as California’s legislative Democrats, are cleverly blocking some of the more obvious exit strategies.
For instance, when the city of Vallejo went bankrupt after coughing up 75 percent of its budget to police and firefighters, the state Assembly introduced legislation that would allow cities to go bankrupt only if they get approval from a commission. Such a commission would of course be dominated by union-friendly members. The result: Cities would be stuck making good on contracts they cannot afford to fulfill.
When the economy was booming, these structural problems could be hidden. But not now. As debt loads become unsustainable, you can expect cuts in services, tax increases, pension-obligation bonds, or some combination of the three.
In California unfunded pension and health care liabilities for state workers top $100 billion, and the annual pension contribution has shot up from $320 million to $7.3 billion in less than a decade. In New York state, local governments may have to triple their annual pension contributions during the next six years, from $2.6 billion to $8 billion, according to the state comptroller.
That money will come from taxpayers. The average private-sector worker, who enjoys a lower salary and far lower retirement benefits than New York or California government workers, will have to work longer, retire later, and pay more so that his public-employee neighbors can enjoy the lifestyle to which they have become accustomed. The taxpayers will also have to deal with worsening public services, since there will be less money to pay for things that might actually benefit the public.
In July 2009, Orange County, California, Sheriff Sandra Hutchens proposed more than $20 million in budget cuts to close the gap caused by falling tax revenue. Her department slashed 40 percent of its command staff, cut a total of about 30 positions, and made changes that affected about 200 positions through reassignments, demotions, new overtime rules, and other maneuvers.
“These are services that we believe are quite important to maintaining public safety, that we’re just not going to be able to continue,” department spokesman John MacDonald told the Los Angeles Times.The sheriff failed to identify another reason for the tight budget: In 2001 the Orange County Board of Supervisors had passed a retroactive pension increase for sheriff’s deputies. That policy nearly doubled pension costs from 2000 to 2009, when pension contributions totaled nearly $95 million—20 percent of the sheriff’s budget. So the sheriff decries an economic downturn that is costing her department about $20 million, but she doesn’t mention that a previous pension increase is costing her department more than double that amount. It’s safe to say that had the pension increase not passed, the department would have money to keep officers on the streets and to avoid the cuts the sheriff claims are threatening public safety...
The Public Sector Menace
In the summer of 2009, various Democratic candidates for California attorney general came before the Police Officers Research Association of California, a union lobbying organization, to ask for its support. According to one attendee (who asked to remain anonymous, given the obvious repercussions for his career), the organization had two basic questions for Assemblymen Ted Lieu (D-Torrance), Alberto Torrico (D-Newark), and Pedro Nava (D–Santa Barbara), each a candidate in the 2010 attorney general race. The first: Did they support the death penalty for cop killers? The second: Would each candidate, as attorney general, make sure the official summary of a state pension reform proposal would be slanted to destroy its chances of passing?
In California crafting ballot language is one of the most important jobs of the state’s attorney general. The police union officials reminded the candidates that 90 percent of voters read nothing more than the ballot title and summary, and they emphasized the importance of putting the kibosh to the measure. My source was appalled, not just by the directness of the question but by the eagerness with which the candidates, especially Torrico, answered it. They all promised they would help kill the measure.
Public-sector unions have a growing influence in state and federal governments, and in the overall labor movement, but they are a relatively recent phenomenon. Civil service unionization in the federal government wasn’t allowed until President John F. Kennedy issued an executive order legalizing it in 1962. In California it didn’t become legal until 1968. Yet now California may be spearheading the re-unionization of the country.
In a 2003 study of union membership rates, the sociologists Ruth Milkman and Daisy Rooks explained that:
“California stands out as an exception to the general pattern of the past decade. Against all odds, union density has inched upward in the nation’s most populous state, from 16.1 percent of all wage and salary workers in 1998 to 17.8 percent in 2002.”The study was produced by the University of California Institute for Labor and Employment, itself a testament to union power in the Golden State. Critics call the institute Union University, arguing that the state is funding a left-wing advocacy and research organization that advances union causes. As the Los Angeles Times explained in a 2004 article about the controversy,
“For years these programs received the majority of their funding from the budgets of the universities where they are housed. Then in the 2000–01 budget, former Gov. Gray Davis approved $6 million to create the institute encompassing the two centers and charged with carrying out ‘research, education and service involving the world of work, and the public and private policies that govern it.’ ”In the 2003 study, Milkman and Rooks found that union growth in California’s public sector has far outpaced such growth in other states, for an obvious reason: “Organized labor has more political influence in California than in most other states.” In more-recent studies, the Institute for Labor and Employment found that for the first time in five decades, U.S. unionization rates actually increased in 2008. The reason: increases in California, mainly in the government sector.
At all levels, state and local government employment grew by 13 percent across the United States from 1994 to 2004. The number of judicial and legal employees increased by 28 percent. The number of public safety workers increased by 21 percent. The number of teachers increased by 22 percent.
Michael Hodges’ invaluable Grandfather Economic Report uses the Bureau of Labor Statistics to chart the growth in state and local government employees since 1946. Their number has increased from 3.3 million then to 19.8 million today—a 492 percent increase as the country’s population increased by 115 percent. Since 1999 the number of state and local government employees has increased by 13 percent, compared to a 9 percent increase in the population.
The United States had 2.3 state and local government employees per 100 citizens in 1946 and has 6.5 state and local government employees per 100 citizens now. In 1947, Hodges writes, 78 percent of the national income went to the private sector, 16 percent to the federal sector, and 6 percent to the state and local government sector. Now 54 percent of the economy is private, 28 percent goes to the feds, and 18 percent goes to state and local governments. The trend lines are ominous.
Bigger government means more government employees. Those employees then become a permanent lobby for continual government growth. The nation may have reached critical mass; the number of government employees at every level may have gotten so high that it is politically impossible to roll back the bureaucracy, rein in the costs, and restore lost freedoms.
People who are supposed to serve the public have become a privileged elite that exploits political power for financial gain and special perks. Because of its political power, this interest group has rigged the game so there are few meaningful checks on its demands. Government employees now receive far higher pay, benefits, and pensions than the vast majority of Americans working in the private sector. Even when they are incompetent or abusive, they can be fired only after a long process and only for the most grievous offenses.
It’s a two-tier system in which the rulers are making steady gains at the expense of the ruled. The predictable results: Higher taxes, eroded public services, unsustainable levels of debt, and massive roadblocks to reforming even the poorest performing agencies and school systems. If this system is left to grow unchecked, we will end up with a pale imitation of the free society envisioned by the Founders.
The Law: Bought and Paid for By Unions
By Warner Todd Huston, Publius' ForumOctober 7, 2010
The Chicago Public School system is out of money. Like every business in the real world one solution was to layoff workers, in this case some 700 teachers. In the real world that is the way the cookie crumbles. Such employees would put themselves on the market and look for new jobs. Life moves on.
But in the world of public employees unions, such employees run to the judges they’ve bought and the law they wrote themselves and had passed by politicians bought and paid for. So taxpayers are forced to give them concessions, paybacks, and special favors. It all amounts to more proof of union graft and corruption at its most common.
This has happened once again in Chicago as the teachers union went to court to prevent the everyday, common cost cutting measure of laying off workers that every normal American is faced with. And, like the true Chicago Way-styled politics that Illinois is used to, the “law” that was written by unions, paid for by unions, and passed by unions was invoked by judges placed in their court rooms by union money.
And who is left holding the bag? The taxpayers, of course...
Majority of Union Members Now Work for Government
By Warner Todd Huston, Publius' ForumSeptember 9, 2010
It is the most important hill that folks interested in good government have yet to conquer and that is the elimination of government employee unions. The Heritage Foundation reports the sad and disgusting news that the majority of union members now work for government, an intolerable situation to say the least.
The BLS’s annual report on union membership shows the labor movement’s decline in membership continued in 2009. While a full 23.0 percent of Americans belonged to labor unions in 1980, by 2008 only 12.4 percent did. In 2009, that figure dropped slightly to 12.3 percent. There are now 15.3 million union members in the United States, 770,000 fewer than in 2008.This is a travesty. Unions are one of the main causes of budgets going into the red in states all across the country. The incestuous relationship between politicians greedy for union political contributions and unions donating to them in order to get ever greater pay and benefits (all conveniently cutting out the will of the voters and destroying good, fiscally responsible government) has about ruined this country.
…What is newsworthy, however, is another figure reported by the BLS: 52 percent of all union members work for the federal or state and local governments, a sharp increase from the 49 percent in 2008. A majority of American union members are now employed by the government; three times more union members now work in the Post Office than in the auto industry.
The Heritage Foundation’s piece also details how these greedy, needless, corrupt unions are spending millions of dollars in campaigning to raise your taxes. You see, without higher taxes, these greedy union thugs can’t continue to push their bought and paid for politicians to continue raising union pay scales, benefits, and pension rates — all of which are exceeding that of the private sector at this point.
Heritage writer James Sherk suggests that Congress reject union demands for higher taxes and should also reject “proposals to increase union membership in the government.” I’d go further. Governments, all governments, should make unions for public employees again illegal like they once were.
It may not be well known, but public employee unions did not exist prior to 1958 when New York Mayor Robert Wagner (Dem.) first signed what he called “The Little Wagner Act” to allow city employees to collectively bargain with the government. A few years later, in 1962, President John Kennedy followed that with Executive Order 10988 that did the same thing for federal employees.
It has become wholly obvious, though, that unionizing government employees is one of the worst ideas ever. In fact, much as I dislike Franklin D. Roosevelt and disagree with the socialist policies that he foisted on America as “helping” her, I have to agree with him on public employee unions. He was against them because he clearly saw the conflict of interest that it would cause.
Our goal as American voters should be to work towards eliminating these destructive unions, not reforming them.
End the Privileged Class
With the Wisconsin showdown at a fever pitch, Mark McKinnon says America doesn’t need public unions anymore—they silence voters’ choice, redistribute wealth, and clog the political system.By Mark McKinnon, The Daily Beast
February 26, 2011
The manufactured Madison, Wis., mob is not the movement the White House was hoping for. Both may find themselves at the wrong end of the populist pitchfork. While I generally defend collective bargaining and private-sector unions (lots of airline pilots in my family), it is the abuse by public unions and their bosses that pushes centrists like me to the GOP.
It is the right and duty of citizens to petition their government. The Tea Party and Republicans seek to limit government growth to protect their pocketbooks. Public-union bosses want to increase the cost of government to protect their racket.
1. Public unions are big money.
Public unions are big money. Paul Krugman is correct: we do need “some counterweight to the political power of big money.” But in the Alice in Wonderland world where what’s up is down and what’s down is up, Krugman believes public unions do not represent big money. Of the top 20 biggest givers in federal-level politics over the past 20 years, 10 are unions; just four are corporations. The three biggest public unions gave $171.5 million for the 2010 elections alone, according to The Wall Street Journal. That’s big money.
2. Public unions redistribute wealth.
Public employees contribute real value for the benefit of all citizens. Public-union bosses collect real money from all taxpayers for the benefit of a few. Unlike private-sector jobs, which are more than fully funded through revenues created in a voluntary exchange of money for goods or services, public-sector jobs are funded by taxpayer dollars, forcibly collected by the government (union dues are often deducted from public employees’ paychecks). In 28 states, state and local employees must pay full union dues or be fired. A sizable portion of those dues is then donated by the public unions almost exclusively to Democratic candidates. Michael Barone sums it up:
“Public-employee unions are a mechanism by which every taxpayer is forced to fund the Democratic Party.”3. Public unions silence the voters’ voice.
Big money from public unions, collected through mandatory dues, and funded entirely by the taxpayer, is then redistributed as campaign cash to help elect the politicians who are then supposed to represent taxpayers in negotiations with those same unions. In effect, the unions sit on both sides of the table and collectively bargain to raise taxes while the voters’ voice is silenced.
But the noisy mob in Madison is amplified beyond its numbers. Wisconsin faces a $137 million deficit this year, and a $3.6 billion shortfall in the next two-year budget. The proposals offered by Gov. Scott Walker would avert 5,500 layoffs of public employees and save $300 million.
The public unions, representing just 300,000 government employees in the Badger State, are trying to trump the will of the voters. Though voters don’t get to sit at the bargaining table, they do speak collectively at the ballot box.
4. Public unions are unnecessary.
The primary purpose of private-sector unions today is to get workers a larger share of the profits they helped create. But with a power greater than their numbers, these unions have destroyed the manufacturing sector, forcing jobs overseas by driving labor costs above the price consumers here will pay.
The government is a monopoly and it earns no profits to be shared. Public employees are already protected by statutes that preclude arbitrary hiring and firing decisions.
The primary purpose of public unions today, as ugly as it sounds, is to work against the financial interests of taxpayers: the more public employees are paid in wages and uncapped benefits, the less taxpayers keep of the money they earn. It’s time to call an end to the privileged class. And the White House makes a mistake if it thinks it can grow a manufactured and uncivil unrest into a popular movement. Voters will not follow those who flee.
As vice chairman of Public Strategies and president of Maverick Media, Mark McKinnon has helped meet strategic challenges for candidates, corporations and causes, including George W. Bush, John McCain, Governor Ann Richards, Charlie Wilson, Lance Armstrong, and Bono.
Inflated Federal Pay: How Americans Are Overtaxed to Overpay the Civil Service
By James Sherk, The Heritage FoundationJuly 7, 2010
Center for Data Analysis Report: Download PDF
Abstract: Salaries and benefits—for identical jobs—are 30 percent to 40 percent higher in the federal government than in the private sector. Claims that this dramatic discrepancy in compensation is warranted because of government workers’ high skills are unjustified, as this study shows. Equally unjustified is the fact that federal workers can rarely be fired, no matter how poor their job performance. Congress should align federal salaries and benefits with market rates—a simple, and fair, move that could save taxpayers nearly $47 billion in 2011. Heritage Foundation labor policy analyst James Sherk provides detailed data on why Congress should not overtax all Americans to overpay the privileged workers in the civil service.
Public Servants Live Better Than the Public, and Federal Pay Continues to Skyrocket
The Daily BailOctober 26, 2009
In 2008 the average federal worker earned twice that of his private-industry counterpart in wages and benefits: $120,000 per year versus $60,000.
Check out the difference in slope of the two lines. Yowza. Federal pay and benefits are up 58% since 2000 compared to just 28% in the private sector.
Of course, when you consider the massive productivity advantage government workers enjoy over their private counterparts, it all makes sense. WTF?
Well, it's all the Democrats fault undoubtedly. Wait, looks like it was Bush.
The George W. Bush years were very lucrative for federal workers. In 2000, the average compensation (wages and benefits) of federal workers was 66 percent higher than the average compensation in the U.S. private sector. The new data show that average federal compensation is now more than double the average in the private sector. In 2008, the average wage for 1.9 million federal civilian workers was $79,197, which compared to an average $50,028 for the nation’s 108 million private sector workers (measured in full-time equivalents). The federal pay advantage (the gap between the lines in the figure above) is steadily increasing. In 2008, federal worker compensation averaged a remarkable $119,982, which was more than double the private sector average of $59,909. - Chris Edwards, Federal Pay Continues Rapid Ascent, Cato Institute, August 24, 2009
What is the Average Teacher Salary in Each State?
Average Teacher Salary in MarylandMaryland teacher salaries have ranked 10th in the nation for the three years of 2009, 2008, and 2007. Each year, Maryland’s teacher salaries have increased by at least 1.94 percent to the annual wage of $56,896.67 in 2009, according to the Bureau of Labor Statistics.
Teaching salaries in Maryland averaged $54,190 in 2007. In 2008, the average teacher salary in Maryland rose to $55,240. Teacher salaries in Maryland experienced a surge of 4.99 percent from 2007 to 2009. From 2007 to 2008, Maryland teacher salaries had increased only 3 percent. An increase of $1656.67 occurred from 2008 to 2009 for teaching salaries in Maryland. From 2007 to 2009, the average teacher salary in Maryland grew $2,706.67.
The Maryland teacher salary schedule below indicates considerable salary growth even as the national ranking remained unchanged over the past three years:
| Average Salary | Percent Change | |||||||||
|---|---|---|---|---|---|---|---|---|---|---|
| Rank | 2009 | Rank | 2008 | Rank | 2007 | 2008 to 2009 | 2007 to 2008 | 2007 to 2009 | ||
| Maryland | 10 | $56,896.67 | 10 | $55,240.00 | 10 | $54,190.00 | 3.00% | 1.94% | 4.99% | |
Financial Data for Maryland
State Spending on Teachers
- Salary expenditure on all teachers (including home schoolers, special education, non-certified teachers): $4,546,093,989
- Benefits expenditures for teachers: $1,662,721,481
- Instructional expenditures for teaching supplies: $203,406,269
- Total current instructional expenditures per student (teacher salary and curriculum): $7,954
- Total current expenditures per student: $13,942
Revenue Per Student From Various Sources
- State revenue per student: $6,502
- Federal revenue per student: $842
State Sources of Revenue for Schools
- Revenue by state property tax: $-1
- Revenue by local government property tax: $3,198,101,418
- Federal grants direct to local districts: $21,766,147
- Federal grants through state: $617,505,010
'Grade Inflation' (Video)
Retirement Inequity in America: Taxpayers Provide the Public Sector (the Haves) with Benefits Lacking in the Private Sector (the Have Nots)
The Cost of Retirement Security in America
The average public sector worker spends about 30 years in the workforce and 30 years retired, and the average private sector worker spends about 40 years in the workforce and 20 years retired. California public sector retirees, on average, receive a retirement pension equal to 66% of their average base pay after working 30 years while private sector retirees receive retirement benefits equal to 33% of their base pay after working 40 years (in California the average base pay of public servants is $68,000 while the average base pay of private workers is $41,500). Extrapolated to the United States as a whole, it is clear that the California model would mean that public sector retirees would cost taxpayers $862 billion per year, which is only 6% less than the entire bill for social security for more than six times as many people.In other words, local and state public sector workers (16% of the workforce in California) retire 10 years earlier with retirement benefits 33% greater than private sector workers (84% of the workforce) — all at the expense of the taxpayers.
Free Republic
January 1, 2011
One way to distill the debate over the sustainability of retirement security in the United States is to evaluate the absolute amount of money that will be paid out each year for public sector pensions vs. social security. Doing this removes the necessity to debate what rate at which public employee pension funds can earn investment returns in the market, which presumably diminishes the amount taxpayers have to contribute to fund these pensions. Instead of evaluating how much money has to go in to fund retirement benefits, this post evaluates how much will come out in actual retirement payments.
Making this analysis easier is the fact that the United States, almost uniquely among nations, enjoys an age distribution that is, for people under 60, almost evenly distributed. As the table below indicates, there are about 20 million people in each five year age group, starting with children under five years old, all the way through adults between the ages of 55 and 60. It is a fairly safe assumption that this trend will continue over the next 40 years, and in fact, if you review the United States — 2050 population pyramid projection from the U.S. Census Bureau, that is exactly what is expected. As will be seen, this even distribution of age groups in the U.S. makes projecting future aggregate retirement payouts for social security and public sector pensions somewhat easier.

Before reviewing the actual calculations, it is also important to note the significant differences between the formulas governing social security benefits vs. the formulas governing public sector pension benefits. One of the most important of these differences is the fact that the social security benefit is progressive, that is, the more you make when you are working, the lower the percentage of your earnings will be realized in social security benefits.
The table below presents graphically the information provided by the Social Security Administration in their “Estimated Retirement Payments Chart.” As can be seen, the retirement benefit provided by social security — as a percentage of career earnings — drops of significantly the more someone earns.

With public sector pensions, there is no ceiling on benefits, or formula in place to diminish the payouts for people who are highly compensated.
For the purposes of analysis, the assumption here is that the retirement formulas that apply to public sector employees in California are typical of public sector employees in the other 49 states. In reality, many of the larger industrial (or post-industrial) states in the U.S. match California’s public sector employee retirement benefit formulas, as does the federal government, but this isn’t necessarily true everywhere.
Nonetheless, since California’s public sector unions and public sector pension funds — echoing their counterparts in the other states who grant retirement benefits to their public employees at a level matching California’s — are generally proclaiming that these benefits are not inequitable and are not unsustainable, this analysis will estimate total retirement payouts per year for social security vs. public sector pensions as if every public agency in the U.S. had the same benefits structure as California’s.
In the next table, “What if the U.S. Had California’s Public Sector,” several assumptions are made that are fairly representative of the relative work histories and compensation profiles of public vs. private employees in California. The average public sector worker spends about 30 years in the workforce and 30 years retired, and the average private sector worker spends about 40 years in the workforce and 20 years retired. Because — returning to our population pyramid — the U.S. population is on track to have an even distribution of people in all age groups, this means the ratio of workers to retirees in the public sector is one-to-one, and the ratio of workers to retirees in the private sector is two-to-one. This is not true today, since the nation’s 20 million people per five year age group only begins with people under 60, but it is decidedly the long-term trend facing the U.S.
The other key set of assumptions are the average base pay of public servants in California, $68,000, vs. the average base pay of private workers in California, $41,500, along with the retirement benefit as a percent of base pay, which for the public sector is 66% (documented with sources in “Calculating Employee Benefit Overhead“), and for the private sector is 33% (as documented on table two above).
Melding these assumptions with the respective worker to retiree ratios for the public vs. the private sector yields dramatic results. A final assumption is the percentage of private sector workers vs. public sector workers — using data from California’s Employment Development Department, California Labor Force & Job Numbers, there are 2.5 million government workers in California, 16% of the workforce, and 13.5 million private sector workers in California, 84% of the workforce.

If you know that in the future there will be 20 million Americans in each five year age group, and you know that public sector workers, who comprise 16% of the workforce, are retired for 30 years, then you can reasonably infer that there will be 19 million public sector retirees in the population. Using similar logic, knowing that private sector workers will be retired on average for 20 years, and that they represent 84% of the workforce, you may infer that there will be 67 million of them in the population. Calculating the aggregate retirement payout for both sectors of retirees is now possible.
By assuming these 19 million public sector retirees, on average, received a retirement pension equal to 66% of their average base pay of $68,000 per year, you may estimate the total public employee pension bill per year at $862 billion. Similarly, by assuming these 67 million private sector retirees, on average, received a retirement pension equal to 33% of their average base pay of $41,500 per year, you may estimate the total private employee social security bill per year at $920 billion.
The implications of these calculations are difficult to overstate. Using assumptions which are well documented and representative of the actual wage and benefit realities in California, extrapolated to the United States as a whole, it is clear that the California model would mean that public sector retirees would cost taxpayers $862 billion per year, which is only 6% less than the entire bill for social security for more than six times as many people.
The idea that investment fund returns can mitigate this cost to taxpayers is absurd (ref. “National Debt and Rates of Return“). And even if it were not absurd, the idea that public sector pensions are invested in the market, while social security funds are not, is inexplicable. Either both public sector pension funds and the social security trust fund should be invested in the market, or, better yet, both of them should operate on a pay-as-you-go basis, where current worker withholdings fund current retiree benefits. This would spare our markets both the political agenda of pension bureaucrats controlled by leftist government unions, as well as the massive distortions that are inevitable when trillion dollar funds face the prospect of notifying taxpayers they’ll have to pony up more because their investments didn’t hit their projected returns.
On a pay-as-you-go basis, Social Security is reasonably solvent, requiring only a 17% total withholding (employer plus employee) to maintain current benefit formulas for the next several decades. On the other hand, on a pay-as-you-go basis, public sector pensions will require contributions of 66% of base salary to maintain current benefits into the foreseeable future.
Calls to cut social security’s percentage contribution are irresponsible, but correctable. Calls to maintain public sector pensions without massive increases to fund contributions, on the other hand, are ridiculous.
How Much Do Pensions Really Cost?
The average government worker’s retirement pension is equivalent to the average private sector worker’s base wages while still working! And government workers typically work from ages 25 to 55, then retire for 30 years, while private sector workers typically work from ages 25 to 65, then retire for 20 years.CalWatchDog.com
March 11, 2011
Earlier this week the Sacramento Bee hosted a chat on the topic “Should States Rethink Collective Bargaining.” In addition to journalists from the Bee, participants included Steve Greenhut, editor of CalWatchdog.org, and Art Pulaski, the chief officer of the California Labor Federation, AFL-CIO.
During the hour-long discussion, the topic of public sector pensions came up a few times, and Pulaski stated that the average pension collected by retired state workers in California are not much more than social security. Referencing the chat log, he said:
ArtPulaskiCLF:
the average state worker gets a pension of $24,000 and often without social security. Not lavish by any means (Tuesday March 8, 2011 12:48 ArtPulaski CLF)
the average state worker gets a pension of $24,000 and often without social security. Not lavish by any means (Tuesday March 8, 2011 12:48 ArtPulaski CLF)
This is a profoundly misleading statement. When Pulaski, and others who share his perspective on these issues, use numbers this low, they are reporting an average that includes everyone on the CalPERS retirement rolls, even people who have barely vested their retirement benefit by only working five years for the state. Furthermore, this average includes part-time workers, and it includes long-time retirees who left the workforce before base pay and pension formulas had been increased significantly — and unsustainably — as they have in the last 10-15 years during the economic bubbles.
A more realistic way to gauge the fairness and financial sustainability of state worker pensions is to reference the average pension for currently retiring state workers who have logged 30 years of full-time work for the government. Using data from CalPERS annual report for the fiscal year ended June 30th, 2010, entitled “Shaping our Future,” (ref. page 151) the average pension for a state employee enrolled in CalPERS who retired last year after 30 years of service is $66,828 per year.
This amount, far in excess of the “$24,000″ claim by Pulaski, is based on data provided by CalPERS, and is further evidenced by evaluating the typical pension benefit formulas currently granted government workers in California. People employed by the University of California, for example, as can be seen on the “University Retirement Plan” (ref. page 13), will receive between 60 percent (30 years, age 55) and 75 percent (30 years, age 60) of the average of their final three years salary in retirement. Benefits for state and local public employees in California typically range between 2.0 percent and 2.5 percent times years worked, times their final salary.
For public safety employees, who comprise approximately 15 percent of the state and local public sector workforce in California, pension benefits typically are calculated based on 3.0 percent, times years worked, times their final salary. The labor agreement between Sacramento County and their firefighter union provides a representative example. (Ref. “Agreement between Sacramento Fire Fighters Union and City of Sacramento,” page 55.) For information on all bargaining units and their pensions in the City of Sacramento, refer to the links on their “City of Sacramento Labor Agreements” page. You will see that in the city of Sacramento, whose worker benefits are quite typical of the cities and counties in California, it is typical for workers currently retiring after 30 years to receive about two-thirds of their final salary in pension benefits.
To really understand what this means, it is necessary to come up with two additional estimates:
(1) the average base salary for a government worker in California — which allows one to estimate the average pension of a retired government worker — and
(2) the number of retired government workers.
This allows one to calculate how much money is disbursed each year to pay retirement pensions to retired government workers. This amount, in-turn, can be compared to how much is being disbursed each year to pay retired private sector workers who collect Social Security.
Using California as an example, and using conservative assumptions (because the CalPERS data already noted suggests the average career pension to be far higher than $46K per year), the following table illustrates how much the average government worker makes per year both while working and during retirement, and compares it to how much the average private sector worker makes both while working and during retirement. These figures dramatically illustrate the disparity between government worker compensation and private sector worker compensation.
On average, government workers collect a base salary that is nearly 50 percent more than private sector workers during their active careers, then collect over three times as much through their pensions in retirement than retired private sector workers collect from social security. In fact, the average government worker’s retirement pension is equivalent to the average private sector worker’s base wages while still working!

The amounts presented in the table are fairly easily calculated using core data that any reader is invited to verify for themselves. The average California state and local government worker wage of $68,500 per year is derived from U.S. Census Bureau data which can be found on the following tables “U.S. Census Bureau 2008 Public Employment Data Local Governments California,” and “U.S. Census Bureau 2008 Public Employment Data State Government California.” The average California private sector worker wage of $46,500 per year can be found from the U.S. Bureau of Labor Statistics “May 2009 California Occupational Employment and Wage Estimates.” The average social security benefit for an average wage earner can be found on the “U.S. Social Security Estimated Retirement Payments Chart.”
The cost to Californians of paying government workers, on average, a pension that is literally triple what the average private sector worker collects from Social Security is compounded by the fact that the ratio of government workers to government retirees is on-track to be 1-1, i.e., one worker for each retiree, whereas the ratio of active private sector workers to retired social security recipients is unlikely to ever dip below 2-1. This is because government workers typically work from ages 25 to 55, then retire for 30 years, and private sector workers typically work from ages 25 to 65, then retire for 20 years.
An examination of projected age distributions in America for 2030, as documented on the U.S. Census Bureau’s International Database, indicates the United States is destined to have an even streamed age distribution, i.e., about 20 million citizens in each five year age group, which makes these calculations much easier. This disparity is illustrated in the table below:
What the table demonstrates is the following: Notwithstanding investment returns, if there is only one active government worker — working 30 years — for every retired government worker — retired for 30 years, and if the average government pensioner receives a pension equivalent to two-thirds of what they made when they worked, then funding government worker pensions would require each government worker to contribute an amount equal to 66% of their salary towards supporting the retirees.
By contrast, if at least two private sector workers — who work for 40 years and are retired for half that time — are employed for each one who is retired, and if the average private sector retiree receives a social security benefit equal to one-third of what they made when they worked, then adequately funding social security would require each private sector worker to contribute an amount equal to only 16 percent of their salary towards supporting the retirees.
This reasoning holds enormous implications when assessing the relative long-term viability of government worker pensions vs. Social Security.
Perhaps the most dramatic illustration of the inequity of California’s government worker pensions averaging literally the same amount as what the average private sector worker earns while actively working is illustrated in the next table. The calculations are based on multiplying the average amount of the government worker pensions by the estimated number of retired government workers, and comparing that to the average amount of the social security benefit multiplied by the estimated number of retired private sector workers. To estimate California’s projected population of retired government workers, simply use the same number as their working population, 2.4 million, since on average they work 30 years and are retired 30 years. To estimate California’s projected population of retired private sector workers, similarly, just take the population of active private sector workers, 12.2, and divide by two, since on average they work 40 years and are retired 20 years. Data for these working populations can be found from the California Employment Development Dept., Labor Market Trends 2009.
 On the table, the green columns represent the projected number of retired social security recipients in California, 6.1 million, and the amount they will collect in aggregate in Social Security, $95 billion per year. The blue columns represent the projected number of retired government workers in California, 2.4 million, and the amount they will collect in aggregate in pensions, $110 billion per year. This is an astonishing projection. It indicates that the government will be spending more, in total dollars per year, to pay pensions to retired government workers, than it will be spending, in total dollars per year, to provide social security to retired private sector workers who are nearly three times as numerous.
To the extent these extravagant benefits have been approved by compliant politicians on behalf of government workers in other states, what these figures illuminate for California can be extrapolated to apply across the United States.
To suggest that Wall Street pension fund investments are going to be able to make up for this disparity, and therefore somehow mitigate the burden this disparity places on taxpayers, is not only extremely debatable — because the high returns that pension funds delivered over the past 30+ years were driven by an unsustainable expansion of debt — but also specious. Because if Wall Street investments are the panacea, set to rescue taxpayers from the burden of supporting retired government workers, why are spokespersons for government worker unions blaming Wall Street at the same time as they fail to recognize that their pension funds are Wall Street?
If government worker pensions, whose solvency is currently guaranteed by taxpayers, are to be gambled on Wall Street, why isn’t the Social Security fund also gambled on Wall Street? Why do taxpayers bear the downside of the Wall Street manipulated economic meltdown not only for themselves and their own individual investments, but also take the hit and make up the difference for the government workers and their pension funds?
Anyone representing government worker unions who claims Wall Street is both the problem and the answer should seriously examine their premises. And anyone who suggests government worker pensions are not extravagant, or do not place a crippling burden on taxpayers and government budgets, is not confronting the facts.
Defined-benefit Public Sector Pensions: A Bad Habit Continues
The public sector employees in a pension plan get a total benefit some 25% better than the private sector employee. That is a pretty good incentive to work in the public sector.
The Economist
February 21, 2011
Fresh from a duel with Free Exchange, I now find myself compelled to add some context to a Democracy in America post on the Wisconsin situation.
The problem with public sector/private sector pay comparisons is that pay comes in two forms; current and deferred (ie pensions). A pension promise from the government is a very valuable thing indeed; some states have made it constitutionally protected. So, unlike the typical private sector employee who is now in a DC scheme, the public sector employee has certainty about his or her pension entitlement. If the equity market falters, the DC plan member will suffer; the employer of the DB member will make up the shortfall.
In effect, the employer has written the employee a put option on the market. How valuable is this option? We can make a judgment by looking at the Bank of England scheme. It avoids all equity risk by buying index-linked bonds to cover its pension liability. This costs it 55% of payroll in the current year (the ratio varies with the level of real yields). The average contribution into a DC scheme (employer and employee) is 10%, in both Britain and America. In a room full of actuaries last week, I asked whether this was a fair basis of pay comparsion and the answer was yes.
Now the Bank of England scheme may be more generous than the Wisconsin version; employees can retire at 60, with full inflation-linking. But even if one were to knock 20 points off the contribution rate to 35%, that would still suggest that public sector employees in a pension plan get a total benefit some 25% better than the private sector employee. That is a pretty good incentive to work in the public sector.
UPDATE: I have had a look at the paper which compares Wisconsin public sector and private sector pay. With respect to pensions, it seems to base its calculations on the figure that:
Retirement benefits account for 8% of state and local compensation costs compared with 2.5% to 4.9% in the private sector.But there is a big difference between how much employers are putting aside and the true cost, which is what they have promised. Wisconsin's scheme is fairly complicated but a quick perusal shows that employees can retire at 57, if they have 30 years of employment and that:
There are two methods of calculating retirement benefits, the formula and money purchase methods, and you are entitled to the higher of the two amounts. A formula benefit is based on your three highest years of earnings (your "final average earnings"), a formula multiplier based on your employment category, your years of creditable service (including any creditable military service) and any actuarial reduction for early retirement.The formula appears to be one-sixtieth for years worked after 2000 for most employees but one-fiftieth for executives and protected employees (presumably fire and police). A higher ratio applies to pre-1999 years. No way can that payout be achieved at a cost of just 8% of payroll unless the pension fund has a strategy for beating the tables at Vegas.
10 States Where an Absurd Percentage of the Population Works for the Government
The largest-ever federal payroll will hit 2.11 million in 2011, but the true size of the federal government is much larger: it is estimated to be 15 million or more (including 2 million civil servants, 800,000 postal workers, 1.5 million active duty military and 848,000 in reserve, 8 million contractors, and 3 million grantees). State and local government employs another 18 million. As of April 2009, the size of the U.S. workforce (employed and unemployed) was about 156 million (154,731,000 in the civilian workforce and approximately 1,500,000 in the military workforce). Therefore, almost 10 percent of the U.S. workforce is employed by the federal government and almost 12 percent is employed by state or local government, for a total of 22% of the U.S. workforce employed by local, state and federal government combined. - The U.S. Government's Hidden WorkforceBusiness Insider
June 6, 2010
Greece's bloated public sector employs the same share of the workforce -- 14.1% -- as America's. Some US states are much worse, giving public jobs to nearly 25% of workers.
A new CEPR report analyzes just how bloated our public sector is.
Surprisingly -- as Economix points out -- the biggest public sectors aren't in liberal states like California. They're in states like Kansas, where people often rail against big government.
#10 Nebraska
Public employees: 128,025% of all employees: 16.0
Source: CEPR
#9 New York
Public employees: 1,296,806% of all employees: 16.3
Source: CEPR
#8 Idaho
Public employees: 96,225% of all employees: 16.4
Source: CEPR
#7 Kansas
Public employees: 201,660% of all employees: 16.5
Source: CEPR
#6 West Virginia
Public employees: 114,169% of all employees: 16.7
Source: CEPR
#5 North Dakota
Public employees: 49,454% of all employees: 16.8
Source: CEPR
#4 Mississippi
Public employees: 191,831% of all employees: 18.9
Source: CEPR
#3 New Mexico
Public employees: 148,882% of all employees: 19.9
Source: CEPR
#2 Alaska
Public employees: 60,067% of all employees: 20.8
Source: CEPR
#1 Wyoming
Public employees: 52,433% of all employees: 22.0
Source: CEPR
So, who are all those public workers?
Top public sector jobs:- Local gov. elementary & secondary teachers
- Local gov. secondary school teachers
- State gov. post-secondary teachers
- Local gov. teachers assistants
- Local gov. police & sheriff's patrol officers
- State gov. elementary & secondary teachers
- Local gov. janitors & building cleaners
- Local gov. secretaries, administrative assistants
- Local gov. bus drivers
- Local gov. fire fighters
Public Servants Live Better Than the Public, and Federal Pay Continues to Skyrocket
The Daily BailOctober 26, 2009
In 2008 the average federal worker earned twice that of his private-industry counterpart in wages and benefits: $120,000 per year versus $60,000. Federal pay and benefits are up 58% since 2000 compared to just 28% in the private sector. Of course, when you consider the massive productivity advantage government workers enjoy over their private counterparts, it all makes sense. WTF? Well, it's all the Democrats fault undoubtedly. Wait, looks like it was Bush.
If you drive through Northern Virginia, you will find nearly entire neighborhoods of $500,000 to $900,000 homes owned by government workers or contractors. Then you can drive five streets over and find $200,000 to $400,000 homes owned by those who pay the salaries for those government employees. It’s a fascinating distribution of wealth.
Most government employees and contractors could not earn more than $60,000 on the free market. Their only chance to make that kind of money comes from having an employer that not only never has to make a profit but can forcibly take money through taxation. The answer is that both are deeply to blame. Don't be fooled. There's nary a difference between Democrats and Republicans when it comes to growth of government. Both parties are completely, sadistically, out of control. There is NO spending restraint on either side of the aisle, just hot air, promises, and purple unicorns. Oh and bubbles.
The Richest Counties in America
MainStreetMarch 8, 2012
While many Americans struggle to find jobs, balance their budget and get by with less, some folks are still living high on the hog.
Looking at the most recent Census Bureau data from 2010, we chose the 15 counties in the U.S. with the highest median household income. With three counties exceeding the $100,000 mark, life seems pretty good in these areas, even as the U.S. median household income declined 2.3% from 2009 to 2010. Still, the following 15 richest counties still have a median income that is about double the national average of $49,445.
Here are the five richest [four of the five are suburbs of Washington, DC, where government employment is concentrated]:
5. Arlington County, Va.
Median Household Income: $94,986
Living in Arlington isn’t cheap, so you’d better be making at least the median household income to live in this county that sits just outside of Washington, D.C.
Arlington may not be the richest, but it does set a record for real estate values. The median value of owner-occupied homes in Arlington county is $571,700 – almost $70,000 more than any other county on our list.
This county also stands out as the most educated on our list – 70.1% of residents hold a bachelor’s degree or higher.
4. Hunterdon County, N.J.
Median Household Income: $97,874
The richest county in New Jersey, Hunterdon just missed the six-figure mark in median household income. Located just west of Somerset County, which took the eighth-richest county spot, Hunterdon’s income has actually crossed the $100,000 mark before.
While some might assume that Hunterdon’s residents make high salaries by commuting to New York City, where salaries are higher than the national average, the truth is that almost 94% of residents stay in-state for work. In fact, more residents commute to Pennsylvania for work than New York.
3. Howard County, Md.
Median Household Income: $101,771
With an astounding 58.3% of residents holding a bachelor’s degree or higher, Howard County shows that higher education can pay. One of only three counties that have a six-figure median household income in the U.S., Howard is located between Baltimore and Washington, D.C., attracting the extremely affluent. The median value of owner-occupied homes in the county is $456,200.
2. Fairfax County, Va.
Median Household Income: $103,010
Fairfax County is one of the largest counties in terms of population to make our list (1,081,726 residents in 2010), but it is also notable for its real estate. Fairfax is one of only two counties on our list to break the half-million mark in home values. Coming in at $507,800 for the median value of owner-occupied homes, the county truly has some spectacular real estate.
Government buffs will be excited to learn that Langley (headquarters of the CIA) is within the county line, so government employees must be making a decent amount of money these days. Also, the unemployment rate in the county has been astoundingly low historically, hitting 1.4% in 1999.
1. Loudoun County, Va.
Median Household Income: $119,540
With a median household income that is a full $16,000 higher than our second-place finisher, Loudoun County has trounced the competition on its way to becoming the richest county in America.
Another county surrounding our nation’s capital, Loudoun borders both West Virginia and Maryland and is the home to Washington Dulles International Airport. The Appalachian Trail runs along its western border and the area was largely an agricultural community until the airport was built in the 1960s.
The population has continued to increase since then, with the area nearly doubling in population size from 2000 to 2010. The poverty rate is also at an incredibly low 3.2%.
Click here to see all of the Richest Counties in America.
Federal salaries have grown robustly in recent years, according to a USA Today analysis of Office of Personnel Management data. Government-wide raises for top-paid staff have increased in every department and agency. The Defense Department had nine civilians earning $170,000 or more in 2005, 214 when Obama took office and 994 in June. The biggest pay hikes have gone to employees who have been with the government for 15 to 24 years; since 2005, average salaries for this group climbed 25 percent compared with a 9 percent inflation rate. Medical doctors at veterans hospitals, prisons and elsewhere earn an average of $179,500, up from $111,000 in 2005. Federal workers earning $150,000 or more make up 3.9 percent of the workforce, up from 0.4 percent in 2005. [Federal pay continues to rise; GOP eyes freeze, AZCentral.com, November 10, 2010]
According to the Bureau of Economic Analysis for 2008 (an organization within the Department of Commerce), the average federal employee made $79,197, excluding benefits; when benefits were added in, the average federal employee's total compensation was $119,982. The average private sector employee made $49,935; when benefits were added in, the average private employee's total compensation was $59,909. Stated differently, the benefit cost for the average federal employee back in 2008 was $40,785; the average benefit cost for private sector employees for the same year was $9,974. [Ralph Smith, Federal Pay Gap With Private Sector Growing, FedSmith, August 25, 2009]
Figures by the US Census Bureau reveal sharply worsening conditions for tens of millions of Americans under the impact of the economic crisis and the accumulation of vast wealth by a relative handful. Overall, the 2009 American Community Survey reveals that median household income fell in the US nearly 3 percent between 2008 and 2009, from $51,726 to $50,221. This was the second consecutive year in which household incomes dropped. Median income declined in 34 states, and increased only in sparsely populated North Dakota. [2009 Income Gap in the U.S. Highest on Record, Socialist Equality Party, September 29, 2010]
The federal civilian workforce has become an elite island of secure and high-paid workers, separated from the ocean of private-sector American workers who must compete in today’s dynamic economy [the public servants have become the public's masters]. The pay gap between federal workers and the rest of the economy is getting wider. Since 1990, average compensation has increased 115% in the government and 69% in the private sector, while average wages have increased 104% in the government and 65% in the private sector. The solution to the problem? Freeze federal pay rates for several years and urge Congress to examine fringe benefits packages for possible savings. The coming retirement boom provides an opportunity to turn functions over to the private sector to let market wage rates determine salaries with more efficient compensation policies. [Chris Edwards, Federal Pay Outpaces Private-Sector Pay, The Cato Institute, May 2006]
In 1953, about 75 percent of Federal employees had a GS level of 7 or below. By 2009, in contrast, more than 70 percent of the workforce was GS 8 or higher. (The 2010 pay scale for a GS 8 is $46,745 - $60,765; for a GS 15, it is $123,758 - $155,500) [From A Government Document in Which Government Employees Justify their High Salaries]
In 2010 a USA Today analysis reported that federal civil servants earned in 2009, on average, twice as much in pay and benefits ($123,049), including unrealized pension benefits, as the average private worker ($61,051). Average benefits were worth $41,791, most of it due to pensions. The average federal salary grew 33% faster than inflation from 2000 to 2009. Average compensation grew 36.9% since 2000, after adjusting for inflation, compared with 8.8% for private workers. The federal compensation advantage had grown from $30,415 in 2000 to $62,000 in 2009. [From Wikipedia]
Coming on the heels of the establishment of the Department of Homeland Security’s (DHS) similar authorities regarding pay, 2003 may represent a turning point in the way federal employees are compensated for their work. This year we should have been celebrating our second year of full comparability under the FEPCA, since the year 2002 should have represented the milestone for a complete realization of the local comparability system for federal General Schedule (GS) employees. Under the carefully crafted bipartisan Federal Employees Pay Comparability Act of 1990 (FECPA), the 10-year phase-in of locality pay adjustments should have been completed, with the end result of GS workers finally being paid salaries comparable to the private sector on a locality by locality basis. [From the General Schedule Pay System for Federal Employees and FEPCA]
Political tension is bound to grow when jobs disappear faster in the private than the public sector, just as compensation in the former is squeezed more. There was a time when government work offered lower salaries than comparable jobs in the private sector, a difference for which the public sector compensated by providing more security and better benefits. No longer. These days, government employees are better off in almost every area: pay, benefits, time off and security, on top of working fewer hours. Public workers have become a privileged class — an elite who live better than their private-sector counterparts. Public servants have become the public's masters. Mort Zuckerman recommends creating independent commissions to fix salary scales and benefits for public employees, in addition to creating "more reasonable retirement ages," especially for new employees. Such reforms would be difficult, though, because as Zuckerman points out, the willingness of lawmakers to kowtow to Big Labor's demands automatically tips the scale in favor of big government. [Steve Everley, Public Servants are the Public's Masters, American Solutions, September 10, 2010]
The largest-ever federal payroll will hit 2.15 million people in 2010 and 2.11 million in 2011, but the true size of the federal government is much larger: it is estimated to be 15 million or more. To be more specific, by 2005, the true size of government reached 14.6 million employees, including 1.9 million civil servants, 770,000 postal workers, 1.5 million active duty military and 848,000 in reserve, 7.6 million contractors, and 2.9 million grantees. State and local government employs another 18 million (the nonprofit sector employs as many as 11 million Americans). [Stephen Dinan, The U.S. Government's Hidden Workforce, The Washington Times, February 2, 2010]
As of April 2009, the size of the U.S. workforce (employed and unemployed) was about 156 million (154,731,000 in the civilian workforce and approximately 1,500,000 in the military workforce). Therefore, almost 10 percent of the U.S. workforce is employed by the federal government and almost 12 percent is employed by state or local government, for a total of 22% of the U.S. workforce employed by local, state and federal government combined.
In addition, about 1 in 5 Americans receive Social Security or a government pension. And about 19 million others get food stamps, and two million get subsidized housing. For these categories, dependents as well as the direct recipients of government income are counted.
Slightly over half of all Americans -- 52.6 percent -- now receive significant income from government programs. That's up from 49.4 percent in 2000 and far above the 28.3 percent of Americans in 1950. If the trend continues, the percentage could rise within ten years to pass 55 percent, where it stood in 1980 on the eve of President's Reagan's move to scale back the size of government. That two-decade shrink-the-government trend now appears over, if for no other reason than demographics. The aging baby-boomer generation is poised to receive big payments from Social Security and government healthcare programs.
A democracy is always temporary in nature; it simply cannot exist as a permanent form of government. A democracy will continue to exist up until the time that voters discover that they can vote themselves generous gifts from the public treasury. From that moment on, the majority always votes for the candidates who promise the most benefits from the public treasury, with the result that every democracy will finally collapse due to loose fiscal policy, which is always followed by a dictatorship. [Justice Litle, Is America’s Economic Recovery on the Whole Based on a Rotten Sham?]
The George W. Bush years were very lucrative for federal workers. In 2000, the average compensation (wages and benefits) of federal workers was 66 percent higher than the average compensation in the U.S. private sector. The new data show that average federal compensation is now more than double the average in the private sector. In 2008, the average wage for 1.9 million federal civilian workers was $79,197, which compared to an average $50,028 for the nation’s 108 million private sector workers (measured in full-time equivalents). The federal pay advantage (the gap between the lines in the figure above) is steadily increasing. In 2008, federal worker compensation averaged a remarkable $119,982, which was more than double the private sector average of $59,909. [Chris Edwards, Federal Pay Continues Rapid Ascent, Cato Institute, August 24, 2009 , Daily Markets, April 20, 2010]
The federal government does not create a traditional sellable product and thus produces no revenue outside of what it collects from taxpayers. As of 2008, the average federal salary was $79,197, compared with $49,935 for the average private sector employee. In other words, the average federal bureaucrat makes almost twice as much as the average working taxpayer. Add the value of benefits like health care and pensions, and the gap grows even bigger. The average federal employee’s benefits add $40,785 to his annual total compensation, whereas the average working taxpayer’s benefits increase his total compensation by only $9,974. In other words, federal workers are paid on average salaries that are twice as generous as those in the private sector, and they receive benefits that are four times greater. [Brandon Greife, The Public Sector Weight Around Taxpayers’ Necks, RedStates.com, May 4, 2010]
Federal workers now earn, in wages and benefits, about twice what their private sector equivalents get paid. They often have Cadillac health plans and retirement benefits far above the private sector average: 80 percent of public-sector workers have pension benefits, only 50 percent in the private sector. Many can retire at age 50. Merely rolling federal employee pay back to where it was in 1998 relative to the private sector, and shifting state and local government pay back to 2005 relative levels, would save $116 billion annually from government costs. [Ed Lasky, Obama and the Government Employees, American Thinker, February 12, 2010]
Federal Employees Retirement System (FERS):

According to the Bureau of Economic Analysis for 2008, the average federal employee made $79,197 [the average private sector employee made $49,935]. The pension for the average employee can be calculated as follows:
$79,197 x 30 Years x 1% = $23,759
$79,197 x 40 Years x 1% = $31,678
$79,197 x 40 Years x 1% = $31,678
Understanding the FERS Retirement
When we talk about your FERS Retirement, we're really talking about several different benefits. FERS (Federal Employees Retirement System) has three main components:

- Basic FERS Pension
- Social Security
- Thrift Savings Plan (TSP)
As a FERS, you have a chance to take a more active role in managing your own retirement than CSRS do. But, that means you need to stay up-to-date on your benefits.
Here are some important things you need to know about each part of your FERS retirement...
Reductions to Your FERS Pension
There are some choices you can make that will reduce the amount of your FERS pension:
- Retiring Before Age 62 with MRA+10If you retire before age 62 on an Early FERS Retirement (MRA+10), your pension will be reduced. Your FERS pension will be PERMANENTLY reduced by 5% for every year you are under age 62. Click here to see an example of this reduction and how it might affect you
- Survivor BenefitsYour FERS Pension could also be reduced if you choose survivor benefits. Will my survivor still get my pension when I die?
Employees covered under the Federal Employee Retirement System (FERS) are typically eligible to receive Social Security benefits when they retire. Every pay period, the Federal Government takes out 6.2% of your basic pay to put towards Social Security. But just like your FERS pension, your Social Security benefit is not based on your contributions - it is based on other factors.
Thrift Savings Plan for FERS
The Thrift Savings Plan (TSP) is a special account for Federal Employees. The TSP was created as part of the Federal Employees Retirement System in 1986. Most government employees (FERS and CSRS) are eligible for the TSP -- even those hired before it was created.
The TSP allows you to save pre-tax dollars in a special personal account. You can choose how to invest those dollars -- although your choices are limited.
With your FERS retirement pension and Social Security, you will receive fixed amounts. But with your TSP, the amount you receive depends on how much you put in and how well you managed the money.
Your TSP contributions are optional and separate from your FERS pension.
You may also be able to get your Federal Agency [taxpayers] to contribute money to your TSP.
Click here to learn more about the match the government gives FERS employees.
Social Security for FERS
Employees covered under the Federal Employee Retirement System (FERS) are typically eligible to receive Social Security benefits when they retire. Every pay period, the Federal Government takes out 6.2% of your basic pay to put towards Social Security. But just like your FERS pension, your Social Security benefit is not based on your contributions - it is based on other factors.
According to the U.S. Social Security Administration, the Social Security taxes you and other workers pay into the system are used to pay for Social Security benefits.
You pay Social Security taxes on your earnings up to a certain amount. That amount increases each year to keep pace with wages. In 2011, that amount is $106,800.
You pay Medicare taxes on all of your wages or net earnings from self-employment. These taxes are used for Medicare coverage.
If you work for someone else | 2011 Social Security tax | Medicare tax |
|---|---|---|
| You pay | 4.2%* | 1.45% |
| Your employer pays | 6.2% | 1.45% |
| If you are self-employed | ||
| You pay | 10.4% | 2.9% |
Currently, U.S. citizens cannot collect Social Security benefits until age 62. The maximum Social Security benefit is $23,500 per individual.
* The employee contribution was temporary lowered from 6.2% to 4.2% on January 1, 2011.


No comments:
Post a Comment